10-day Golden Week for the first time in history! No. of domestic and international travelers both set to reach new all-time highs
JTB Corp.
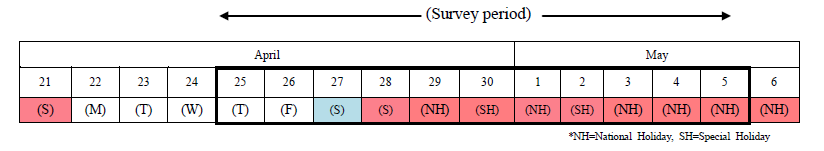
Travel Trends for Golden Week Holiday Period 2019 (April 25 - May 5)
Desire for travel increases year-on-year, with 51.2% of people planning multiple holidays
JTB Corp. has published the results of a survey of forecast travel trends involving at least one overnight stay for the 11 days of the 2019 Golden Week (GW) holiday period (the period from April 25 to May 5) on a departure basis.
The survey was based on a questionnaire on travel trends completed by 2,060 respondents (out of a pre-survey pool of respondents of 20,000), as well as bookings with JTB Group companies, airline reservations and industry trends. The results of this, the 51st such survey since the first in 1969, are as follows.
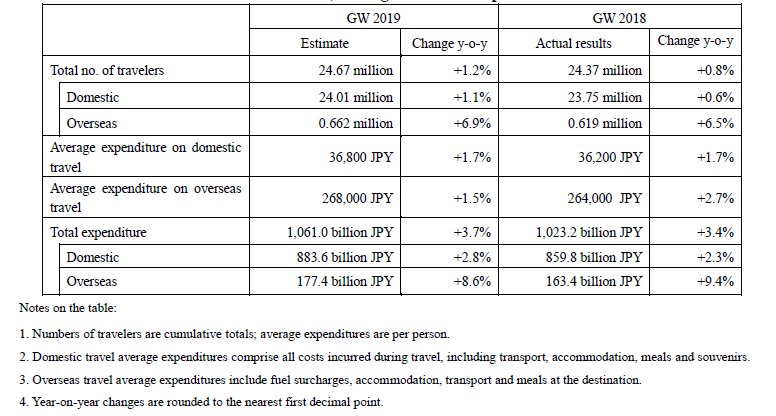
Table 1: Estimates for Number of Travelers, Average and Total Expenditure in GW 2019
Socioeconomic Environment and Consumer Trends
- Socioeconomic environment surrounding travel and leisure consumption
On May 1, 2019, the new Emperor will ascend the throne, and the Imperial era name will change to become “Reiwa.” With the new name incorporating a nuance of “creating and nurturing culture by bringing hearts and minds together,” people’s expectations for the dawning of a new era are growing, and there is a feeling of anticipation and welcome in society, in contrast to the mood of self-constraint that sometimes characterized the current Heisei era. This will be the first GW in the new era and with events and ceremonies related to the accession to the Imperial throne, for the first time ever there will be a ten-day holiday period.
The Japanese economy is continuing on a gentle recovery track. Although there are some elements of concern, in the Monthly Economic Report for March issued by the Japanese government, the judgment on the economic situation was that, “The Japanese economy is recovering at a moderate pace while weakness is seen recently in exports and industrial production in some sectors.” In terms of employment, the ratio of job openings to job applicants in February remained at the same level as the previous month at 1.63, and the total unemployment rate had improved, by falling 0.2 points to 2.3%. However, the outlook for company results for the fiscal year ending March 2019 is that profits may fall for the first time in three years, which is a potential cloud on the horizon that adds to a sense of opacity about the future.
According to the Opinion Survey on the General Public's Views and Behavior implemented by the Bank of Japan (announced January 9, 2019), in terms of impressions of household circumstances, the number of people responding that they “have become worse off” has decreased consistently every month since March 2018 (Fig. 1). In terms of everyday life, gasoline prices remain at a similar level to the previous year (Fig. 2), although from April 2019 various popular and staple products have been subjected to price increases, including milk products and noodles of various types. The consumption tax rate is expected to be increased to 10% in October, although the government is considering various measures designed to reduce the tax burden, including a reduced rate for food products and the issuance of premium vouchers, etc.
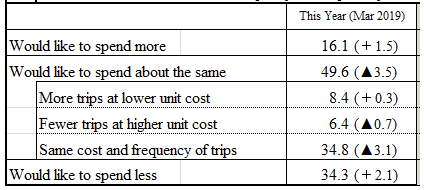
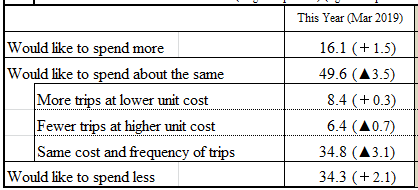
With regard to travel, in the travel trends questionnaire implemented by JTB, when asked about their motivation to spend on travel in the next year, a total of 16.1% of respondents indicated that they “would like to spend more,” whereas those indicating that they “would like to spend less” accounted for 34.3% and those intending to “spend about the same” accounting for 49.6%. This would suggest that due to a variety of factors and unease about the future outlook people are tightening their purse strings (Table 2).
Figure 1: Impression of Household Circumstances (March 2018 _ December 2018)
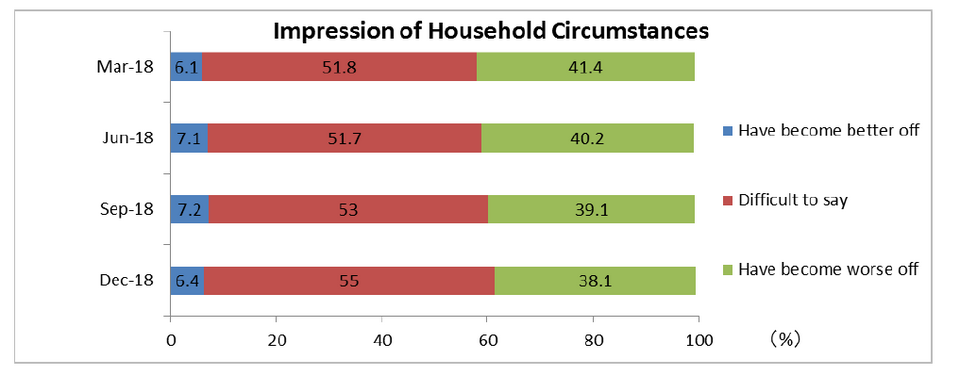
Source: Compiled by JTB Tourism Research & Consulting Co., from extracts of the Bank of Japan’s Opinion Survey on the General Public’s Views and Behavior (76th)
Figure 2: Trends in Gasoline Prices
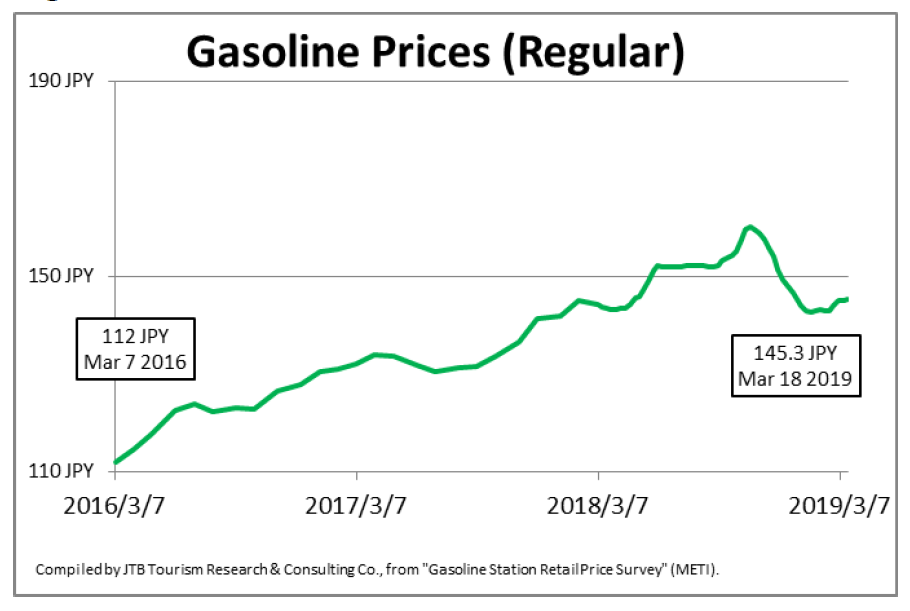
Table 2: Changes in Motivation to Spend on Travel in the Next Year (unit: %) n=20,000
- The GW holiday period is 10 consecutive days for the first time. Desire for travel is high, with 51.2% of respondents indicating that they will embark on multiple holidays.
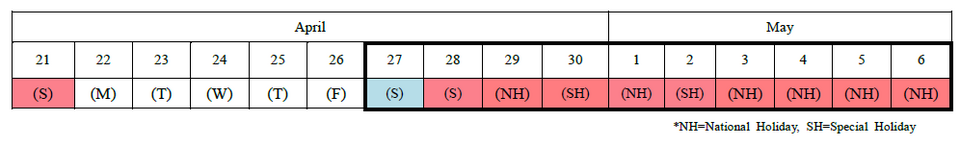
This year the GW holiday period will last for ten days from April 27 (Sat) to May 6 (National Holiday). So how will people be spending this 10-day period? In the travel trends questionnaire JTB asked people about the ways in which they would be taking time off and how they would be spending the holiday period.
(1) Desire for travel up 1.1 points, with 51.2% of respondents planning multiple holidays
Including those people who are planning to return to the family home, a total of 26.3% of respondents indicated that they would be traveling during GW (“Will travel” 12.1%, “Will probably travel” 14.2%), up 1.1 points from the previous year (Table 3). In terms of the frequency of journeys that will be made, the most common answer was “Once domestically” (45.2%), but there were also 29.8% of respondents who indicated plans to travel “3 or more times domestically,” and 4.5% who indicated plans to travel “both domestically and overseas” (Fig. 3). On the other, hand, the most popular responses in terms of reasons for not traveling at GW remained the same as in other years, namely “GW is too crowded,” “Travel costs are too high in GW,” and “I want to relax at home” (Fig. 4).
(2) 31.5% of respondents will have “more than 10 days off myself” during GW
So how many people will actually be having 10 consecutive days of holiday? When asked about their own holidays and those of their family members, 21.7% of respondents indicated, “Both I and my family have more than 10 days off,” and 9.8% indicated that “I have more than 10 days off, but my family have less than 10 days.” This indicates that 31.5% of all people will be taking at least ten days off themselves (Fig. 5).
(3) Major differences between GW this year and last year are “Income has increased” and “We will travel further than last year”
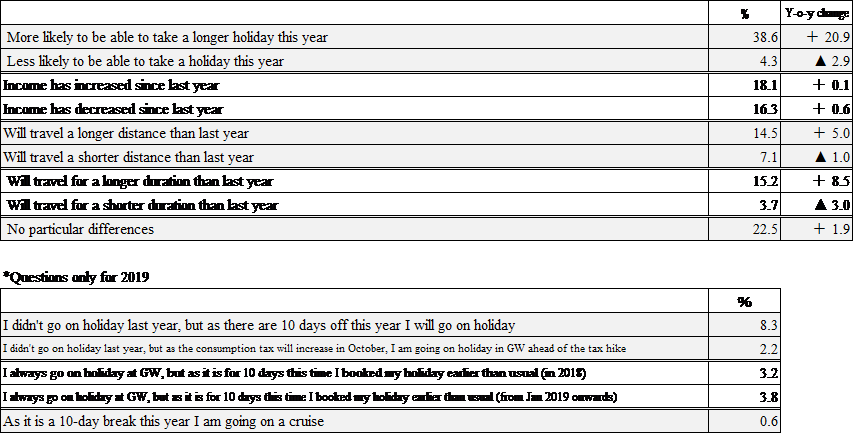
Among the people who indicated that they “will travel” or “will probably travel,” when asked about the differences between GW this year and last year, 18.1% of respondents indicated that “income has increased,” which was more than the 16.3% who indicated that “income has decreased.” In terms of travel destination, 15.2% of respondents indicated an intention to “travel a longer distance than last year,” where those intending to “travel a shorter distance” stood at 7.1%. A total of 15.2% of people responded that they “will travel for a longer duration,” while those planning to “travel for a shorter duration” stood at 3.7%. In response to questions about this year being the first-ever 10-day GW holiday, a total of 8.3% of respondents indicated that “as there are 10 days off this year I will go on holiday.” A total of 7.0% of respondents noted that they had booked earlier than normal, with 3.2% answering that “as it is for 10 days this time I booked earlier than usual (during 2018)” and 3.8% answering that “as it is for 10 days this time I booked earlier than usual (from Jan 2019 onwards).” A total of 2.2% of respondents noted that “as the consumption tax will increase in October, I am going on holiday in GW ahead of the tax hike,” and 0.6% of those questioned answered that, “as it is a 10-day break this year I am going on a cruise” (Table 4).
(4) 27.5% of people indicate their intention to “visit a shrine or temple” around May 1, the day on which the new Imperial era starts
As the ten days of the GW holiday period are in honor of the Imperial succession, the final day of the Heisei era, April 30, and the first day of the Reiwa era, May 1, will fall during GW. Among the people who indicated plans to mark the change in Imperial era name, some the most popular responses were to “Visit a shrine or temple” (27.5%), or “Participate in a commemorative tour” (20.3%)(Fig. 6).
Table 3: Desire for Travel (Unit: %)(single response)
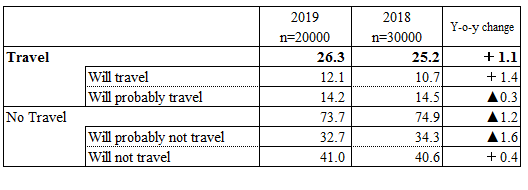
Figure 3: Travel During GW (single response)
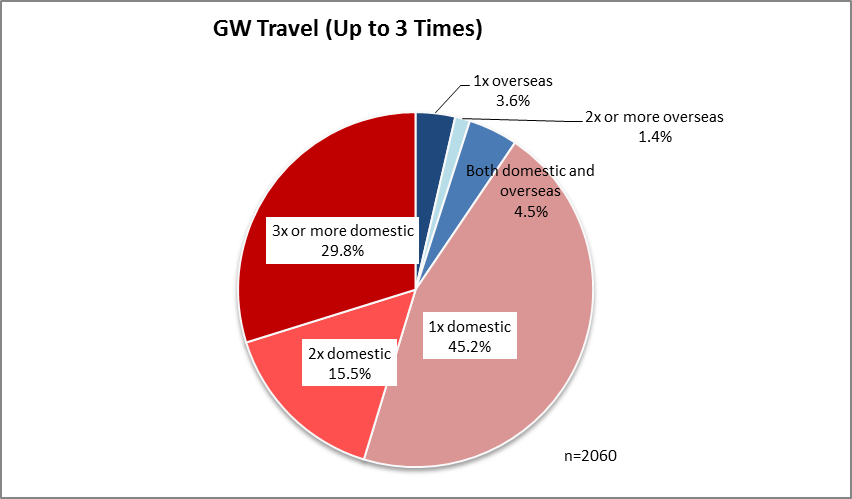
Figure 4: Reason for Not Traveling During GW This Year (multiple responses)
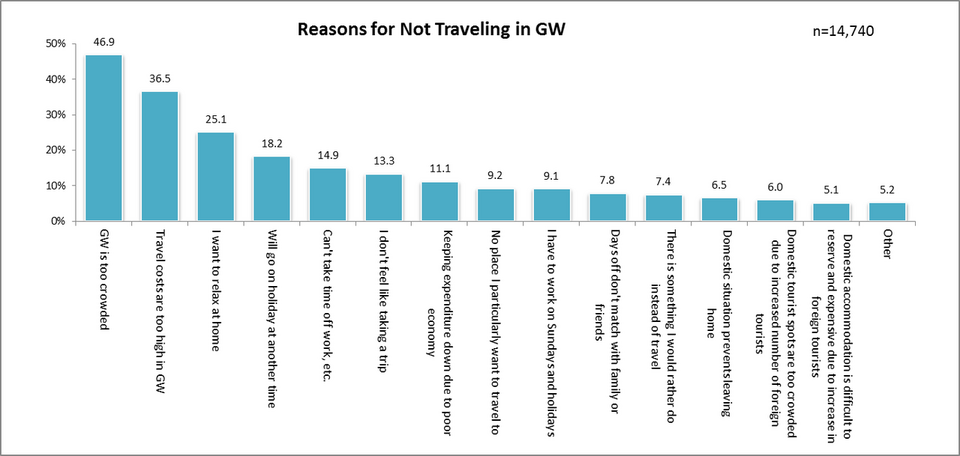
Figure 5: Length of Time Off During GW for Self and Family (single response)
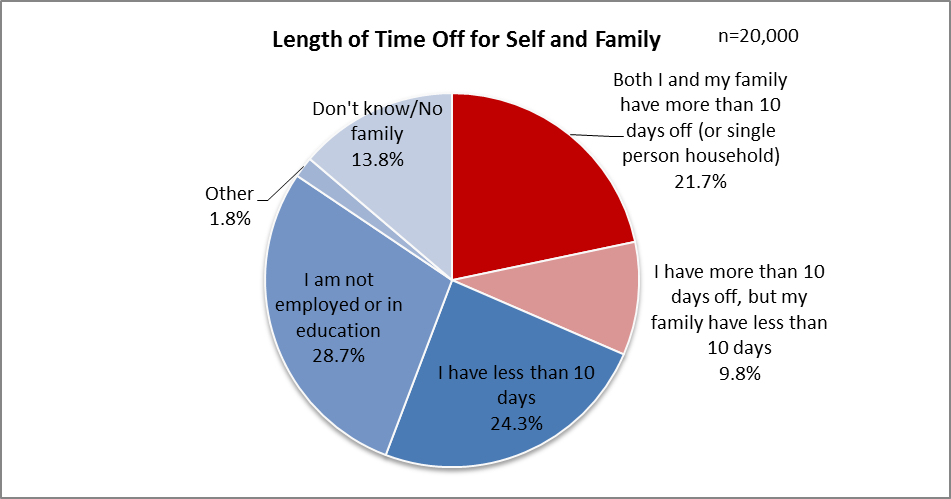
Figure 6: Details of People’s Plans to “Travel or Make a Trip in Honor of the New Imperial Era” (multiple responses)
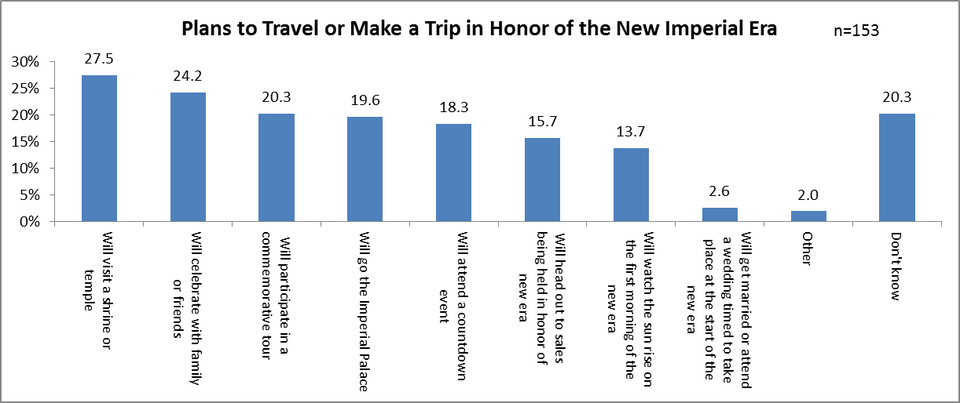
Table 4: Differences Between GW Last Year and This Year (multiple responses) n=2,060
Anticipated Trends in GW Travel 2019
- Number of overseas travelers set to increase to 0.662 million (+6.9% y-o-y), with average expenditure on overseas travel set to rise to JPY268,000 (+1.5% y-o-y) and the peak date for departure expected to be April 27 (Sat)
The number of Japanese nationals traveling overseas in 2018 reached an all-time record of 18.95 million, and since the start of 2019 too, traveler numbers for both January and February have exceeded the numbers recorded in the same months of 2018. Fuel surcharges are relatively lower than last year and on the foreign currency markets there has been a gentle tendency towards a stronger yen since the autumn of last year and into 2019, which is the period when GW holiday bookings are generally made. These have also been positive factors in boosting the desire for travel (Table 5, 6).
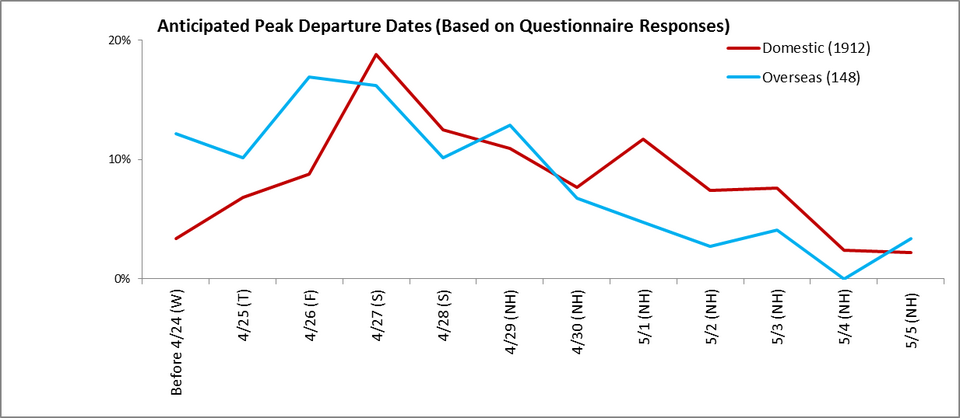
Looking at the responses to the JTB questionnaire, in terms of length of trip, while the most popular answers for overseas travel are “three nights, four days” (17.6%) and “four nights, five days” (17.6%), all responses of “five night, six days” and longer were all up on the previous year. It is likely that more people will seek to travel to medium and long-haul destinations, making the most of the long holiday period (Table 8). In terms of destination, Hawaii remains a firm favorite, with Southeast Asia and Europe also proving popular (Table 10). In terms of travel companions, the most common response is to travel as a family (56.8%), within which the number of people traveling as a couple (23.6%) is down year-on-year, whereas families traveling with children (up to junior-high school age) have increased (16.2%)(Table 11). In terms of planned expenses for GW 2019 the most common response was “up to JPY300,000” at 18.2%, but there was a 9.4 point increase in the number of persons responding a budget of “up to JPY400,000” (14.9%) (Table 14). With regard to anticipated peak departure date, the busiest days are expected to be April 26 (Fri) and 27 (Sat), with departures concentrated around the end of April (Fig. 7). Looking overall at the status of flight bookings and industry trends, the peak date for departures is projected to be April 27 (Sat).
Table 5: Trends in Foreign Exchange Rates (USD, EUR)
(October 2018-March 2019)
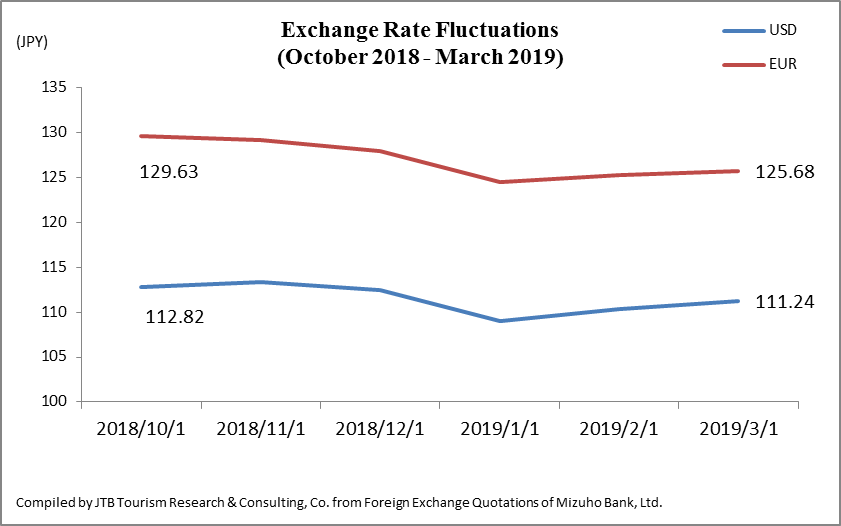
Table 6: Fuel Surcharges (for JAL, one-way flights from Japan; unit: JPY)
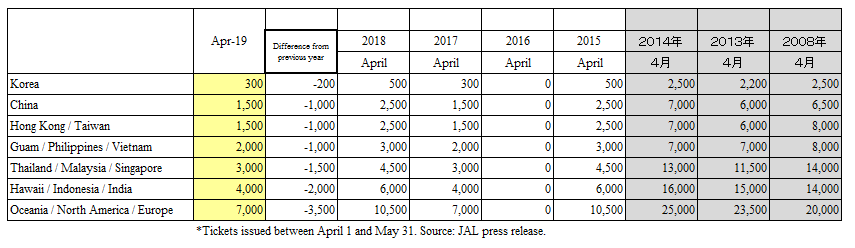
Figure 7: Expected Dates for Departure (based on questionnaire)(single responses)
Looking at the booking status of JTB overseas package tours (LOOK JTB), the projected peak dates for departure are spread out between April 27 (Sat) and May 2 (NH) for short-haul Asian destinations such as Korea and Taiwan, with a departure peak for Hawaii and Guam, etc., on April 28 (Sun), whereas peak departures for long-haul destinations such as the U.S. mainland and Europe are likely to be April 27 (Sat) and 28 (Sun). Popular destinations include Hawaii and Guam as family destinations, short-haul destinations like Taiwan and Vietnam, and long-haul destinations such as Italy and Australia. In terms of the overall ranking for bookings received, the top three positions remain unchanged with Hawaii no. 1, followed by Guam and Taiwan, but Australia in fourth place and Korea in fifth place are perhaps a result of the special nature of this year’s GW holiday period. Myanmar is one of the popular destinations for bookings this year, boosted by the fact that in October last year the Myanmar government waived the requirement for a tourist visa was for a period of one year.
- Number of domestic travelers is set to increase to 24.01 million (+1.1% y-o-y), with average expenditure projected to rise to JPY36,800 (+1.7% y-o-y)
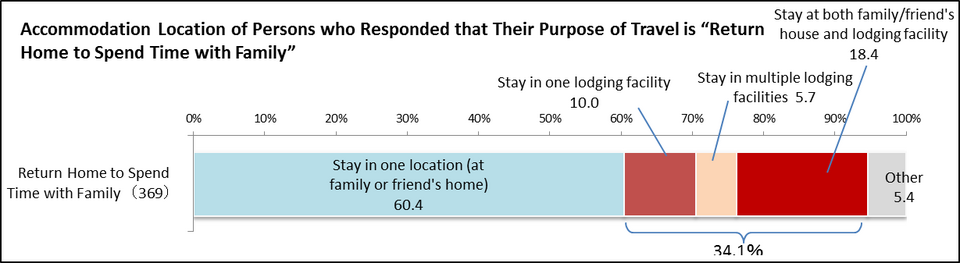
According to the questionnaire results, many people will embark on a long family holiday, either returning to the family home or relaxing with family members. According to the questionnaire, in terms of the length of trip, the most popular response is “one night, two days” (36.9%), but both “three nights, four days” (16.1%) and “five nights, six days” (3.5%) are up year-on-year by 1.2 points (Table 8). In terms of the purpose of travel, the most popular response was to “Return home to spend time with family” (19.0%), up 1.4 points year-on-year (Table 9). In terms of traveling companions, most people will be traveling as a family (66.6%), among which those traveling with children (up to junior-high school age) increased 4.6 points over the previous year to 28.8%, suggesting that many people will be traveling with children this year (Table 11). In terms of means of transportation, the most popular response was “car” (63.6%)(Table 12), and for the means of accommodation, “hotel” is the most popular option at 53.3% (Table 13). Among the 19.0% of people who responded that their purpose of travel is to “Return home to spend time with family,” approximately 30 percent also responded that they would be using a lodging facility. This suggests that even if people are planning on returning to their family home, many are also planning a stay in a hotel or ryokan and aim to visit local tourist sites too (Fig. 8). Peak departure dates are likely to be April 27 (Sat) and May 1 (National Holiday), with a double peak as many people are contemplating multiple trips during the GW holiday period (Fig. 7).
Figure 8: Accommodation Location of Persons who Responded that Their Purpose of Travel is “Return Home to Spend Time with Family”
Looking at the booking status of JTB domestic package tours (ACE JTB), peak dates for departure are expected to be concentrated in April, between April 28 (Sat) and 30 (Special Holiday), with long distance destinations like Hokkaido or Okinawa proving popular. In relation to the accession of the new Emperor, tours to Ise and Shima are selling well, and the Nanki region remains popular since the birth and public display of a baby panda at a zoo there. The Setouchi Triennale 2019 that starts from April 26 (Fri) is also another popular event. For customers from the Tokyo metropolitan region departing to other regions of Japan, the most popular destinations in ranked order are 1) Hokkaido, 2) Universal Studios Japan_ 3) Central Japan (incl. Ise and Hokuriku), 4) Okinawa and 5) Kyoto.
Survey Methodology
Survey period: March 20 to 22, 2019
Respondents: Males and females between the ages of 15 and 79
Sample size: Pre-survey 20,000 persons, actual survey 2,060 persons
Of the 20,000 persons who responded in the pre-survey that they “plan to travel in GW,” a total of 2,060 persons were selected to participate in the main survey
Content: Travel plans involving at least one night away from home departing between April 25 and May 5, 2019.
(Including overseas travel, but excluding trips for commercial or work purposes)
Method: Internet questionnaire
* From this year the survey method has been changed from the previous method of “individual surveys conducted by survey staff using a questionnaire form on personal visits” to “internet questionnaire.” For the GW 2018 market research both types of survey method were implemented in tandem and the year-on-year comparisons this year are based on the responses to the internet questionnaire in 2018.
Table 7: Estimates of Overseas Travelers During GW 2019 (April 25 through May 5, 2019)
(Unit: thousand persons)
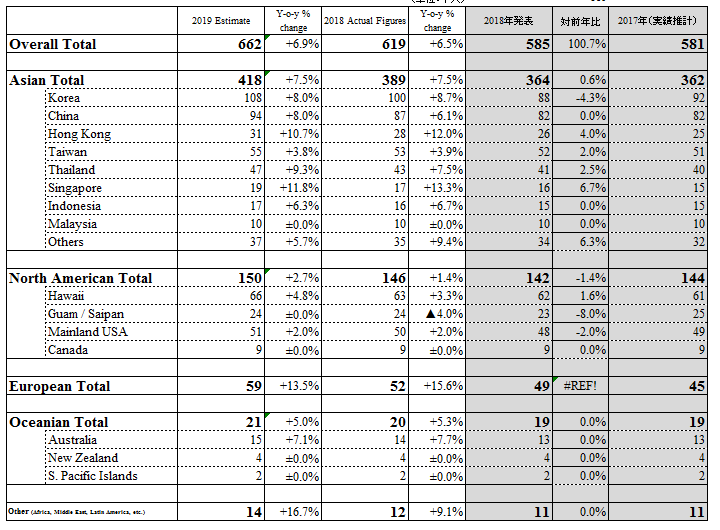
Table 8: Length of Trip
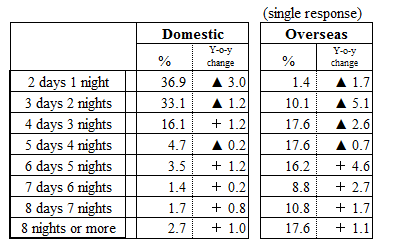
Table 9: Purpose of Travel (Top 10)
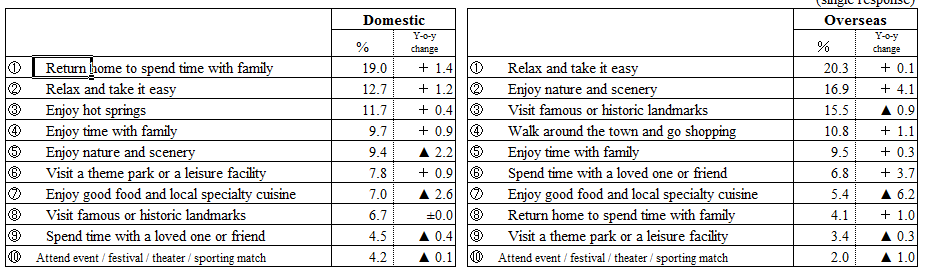
Table 10: Travel Destination
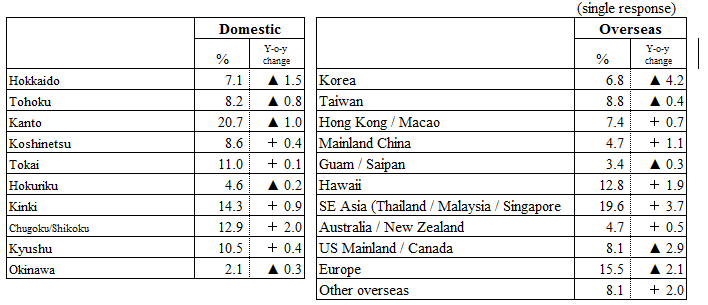
* In the case of multiple travel destinations the furthest one is used as a response.
Table 11: Travel Companions
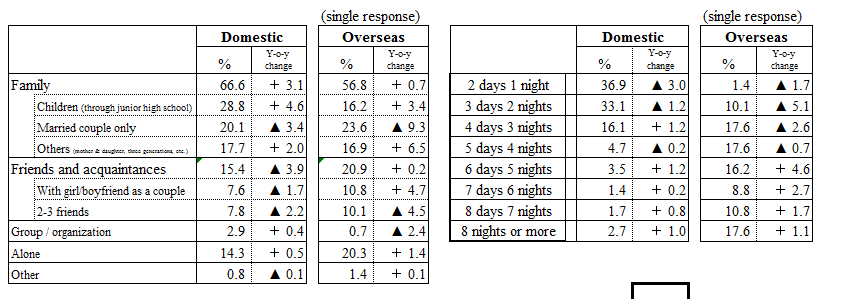
Table 12: Means of Transportation
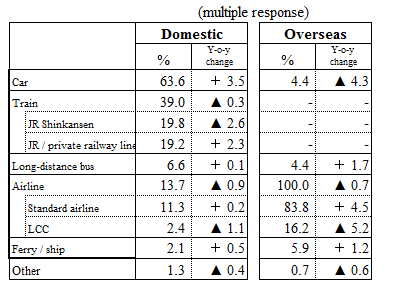 Table 13: Means of Accommodation
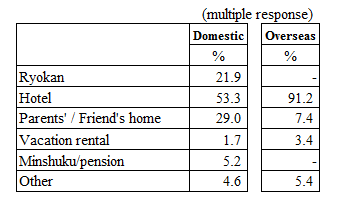
*As types of accommodation for domestic accommodation have been changed and overseas accommodation is only appearing in 2019’s questionnaire, year-on-year comparisons are not available.
Table 14: Planned Expenses for GW 2019 (per person)
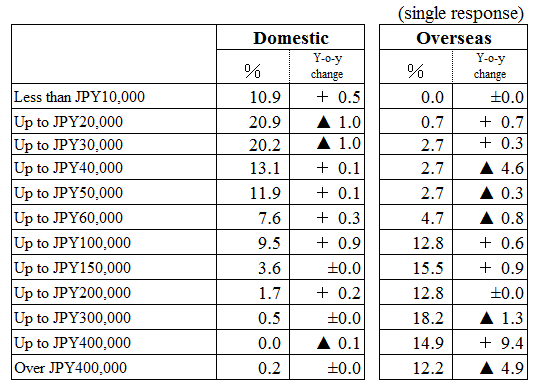
Table 15: Changes in Motivation to Spend on Travel in the Next Year *(same as Table 2 above)
* As some respondents did not answer questions in Tables 8-11 and 14, responses do not total 100%.
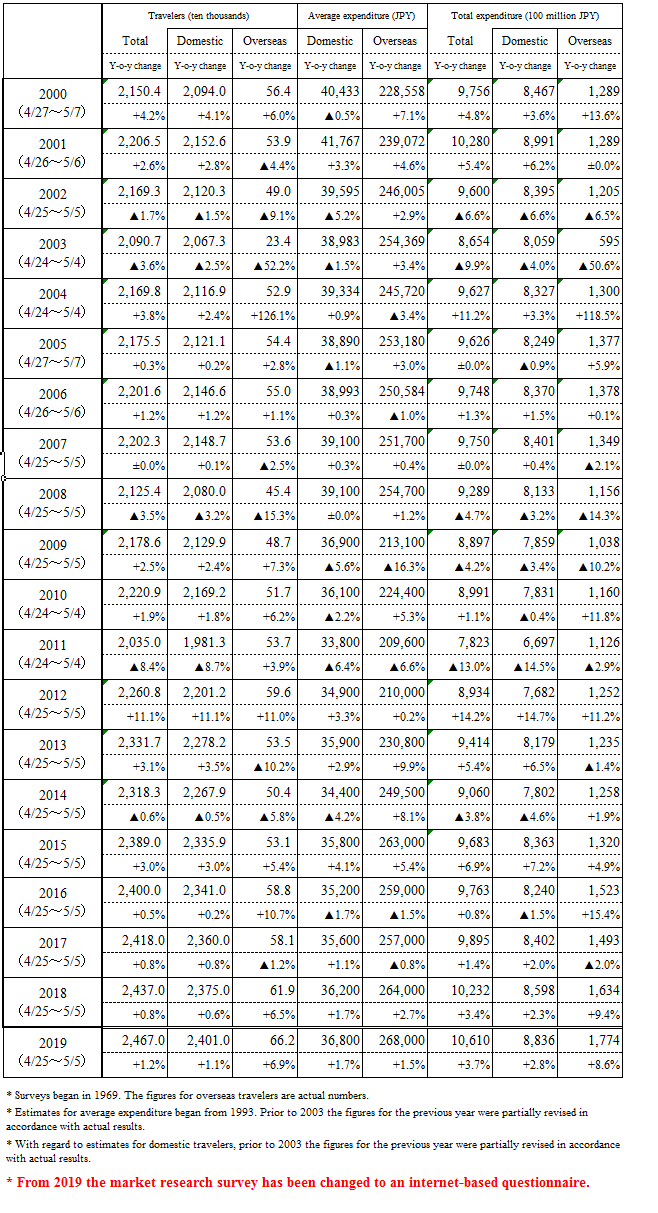
Table 16: Trends in Published Numbers for GW Travel from 2000
Tel: 03-5796-5833