2025/26 Year-End/New Year Travel Trend (Dec. 20, 2025 to Jan. 5, 2026)
JTB Corp.
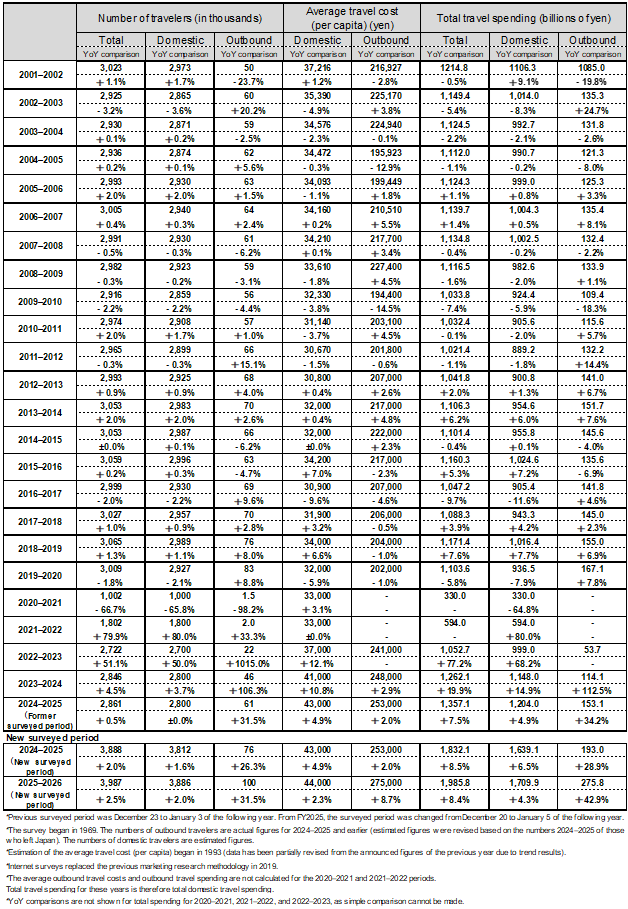
JTB has summarized the outlook for travel trends among people planning overnight or longer travel during the 2025/26 year-end/new year period (December 20-January 5). This report is a compilation of data about overnight or multiple-night travel made by Japanese travelers estimated based on various economic trends, consumer behavior surveys, transportation and tourism-related data, and surveys conducted by the JTB Group. The survey has been conducted on an ongoing basis since 1969. It should be noted that the target period of the survey was changed this year from December 23 to January 3 (previous target period) to December 20 to January 5 (new target period) in line with the times. The results of the recent survey are as follows.
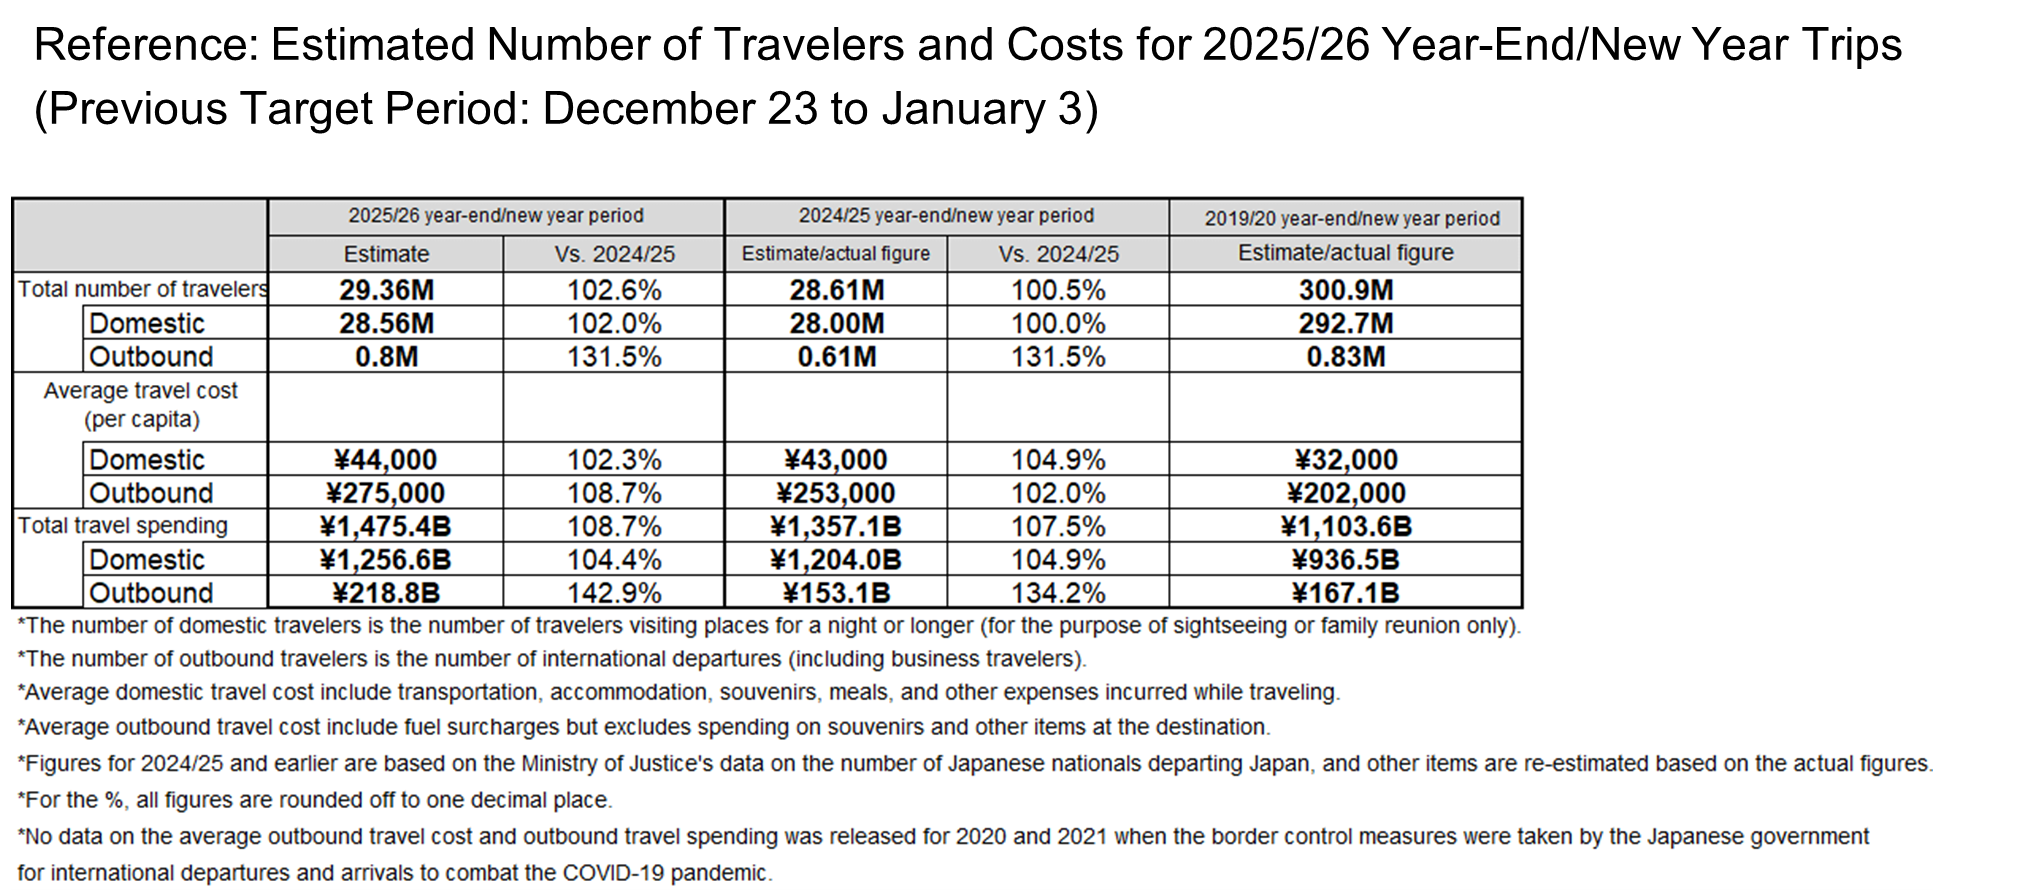
*Please note the data is compared to the previous target period (December 23 to January 3) in figures titled, "Reference."
Travel intent remains solid, centered on family time; total travel spending reached JPY 1.9858 trillion.
In domestic travel, nearby destinations, short stays, and travel by car are mainstream. Family trips that rejuvenate body and mind through nature, gourmet experiences, and hot springs are on the rise.
Overseas travel shows growth in 4-6-night stays, with long-haul destinations performing well. Travel to Hawaii and Europe is expanding, and average trip spend has reached an all-time high.
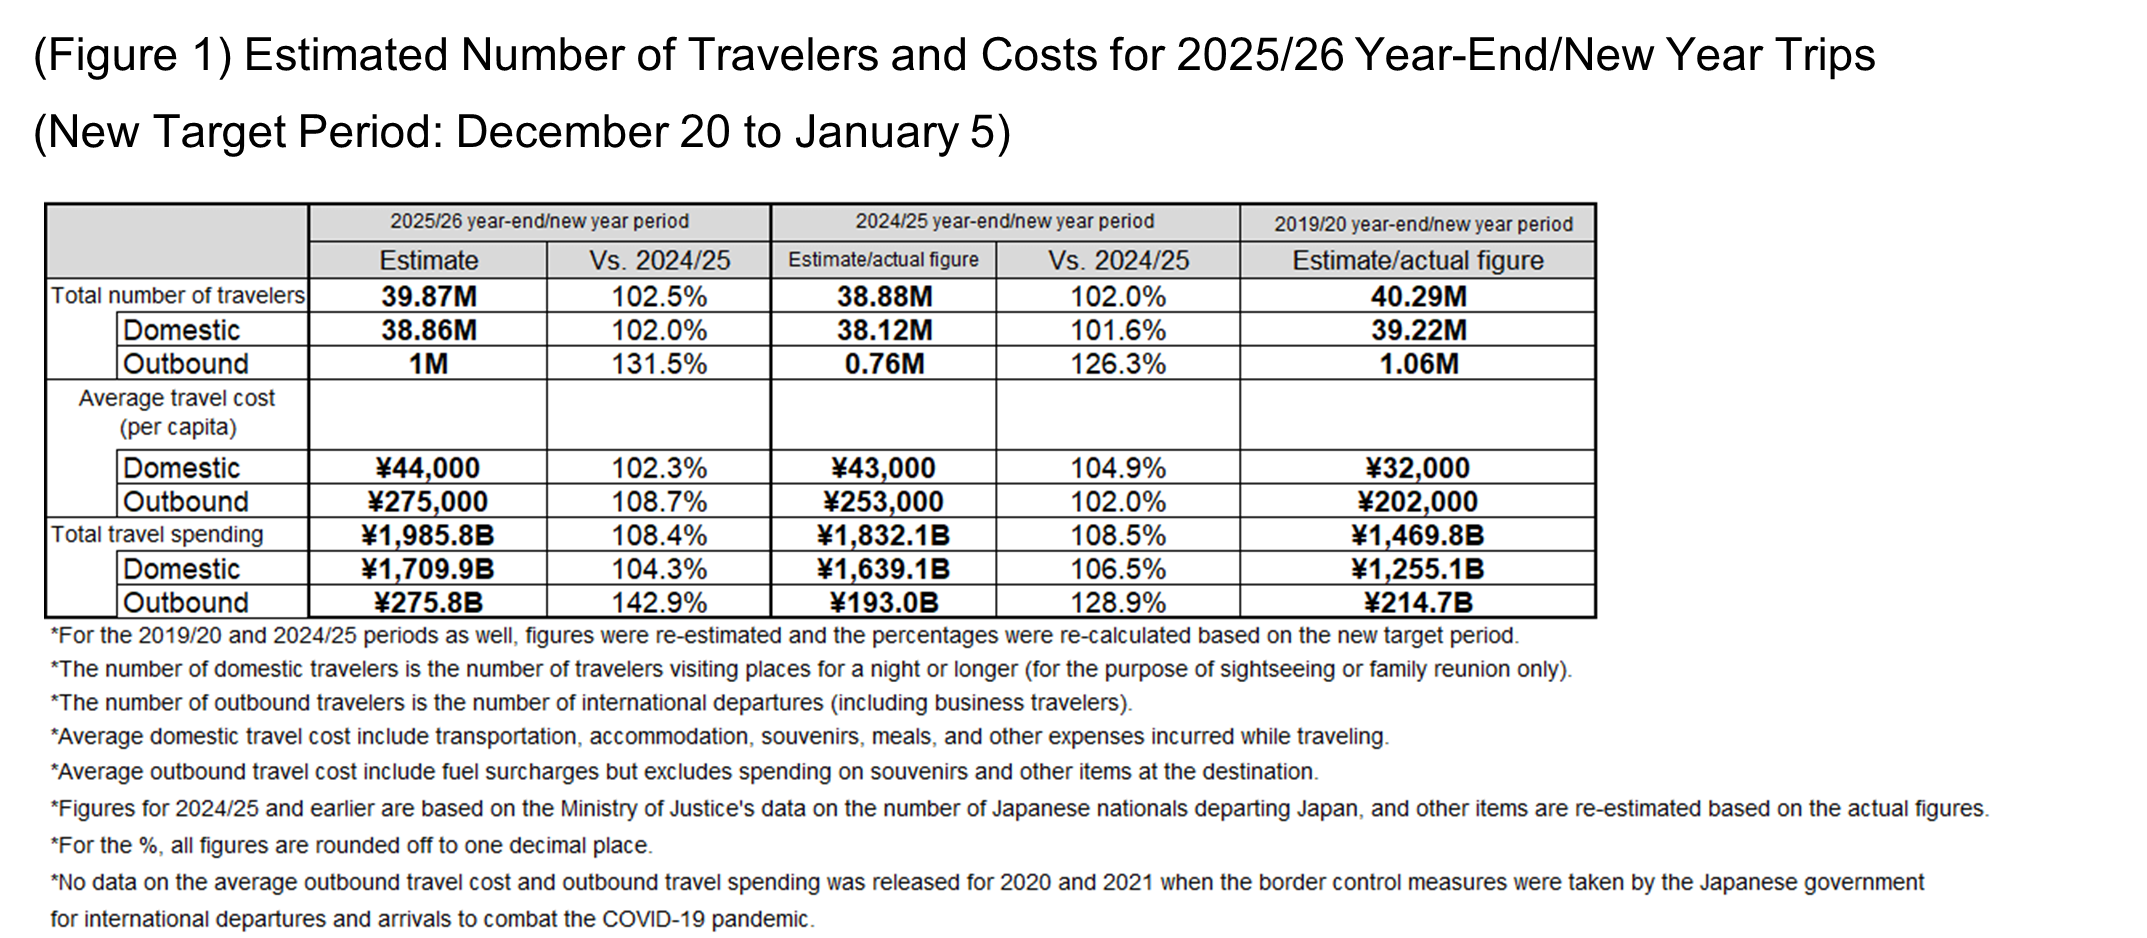
●The total number of travelers during the 2025/26 year-end/new year period is estimated at 39.87 million (102.5% year-on-year).
Total travel spending is expected to be ¥1.9858 trillion (108.4% year-on-year).
●The number of Japanese domestic travelers is estimated at 38.86 million (102.0% year-on-year). The average domestic travel costs at ¥44,000 (102.3% year-on-year), and the total domestic travel spending at ¥1.7099 trillion (104.3% year-on-year).
●The estimated number of outbound travelers is 1 million (131.5% year-on-year). The average outbound travel costs are estimated at ¥275,000 (108.7% year-on-year). The estimated outbound travel spending is ¥275.8 billion (142.9% year-on-year).
[Domestic Travel]
➤Despite lingering uncertainty about the outlook, traveler numbers are up slightly year on year.
For the number of days of travel, relatively shorter trips are popular, but the average cost (per capita) slightly increased partly because of the economic situation and price hikes.
➤Nearby destinations that are accessible to travelers using their own cars with family and trips to destinations within the area of the travelers' residence (intra-regional travel) are in demand.
➤The popularity of trips with a greater focus on enjoying trips such as "Spend time with family," "Relax," and "Enjoy meals, hot springs, or nature" instead of visiting hometown or relatives is increasing.
[Overseas Travel]
➤The number of outbound travelers is expected to exceed the 2024/25 year-end/new year period partly because the 2025/26 year-end/new year period lines up well with the weekends.
➤Medium-length trips of four to six nights are on the rise. Long-haul destinations--such as Hawaii, Europe, the United States, and Australia--are gaining popularity, while short-haul destinations like South Korea are seeing a slight decline. As a result, the average per-person trip cost is projected to increase.
1.Calendar for the 2025/26 Year-End/New Year Period (December 20, 2025 to January 5, 2026) and Travel Trends
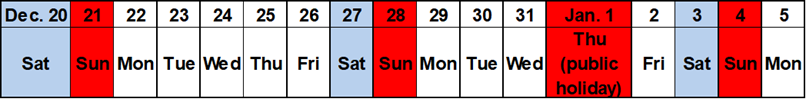
According to the calendar of the 2025/26 year-end/new year period, December 27 and 28 are weekends and January 4 is Sunday. Therefore, in case the period from December 29 to 31 is taken as days off in addition to the new year holiday period (January 1 to January 3), people can enjoy a 9-day holiday (from December 27 to January 4).
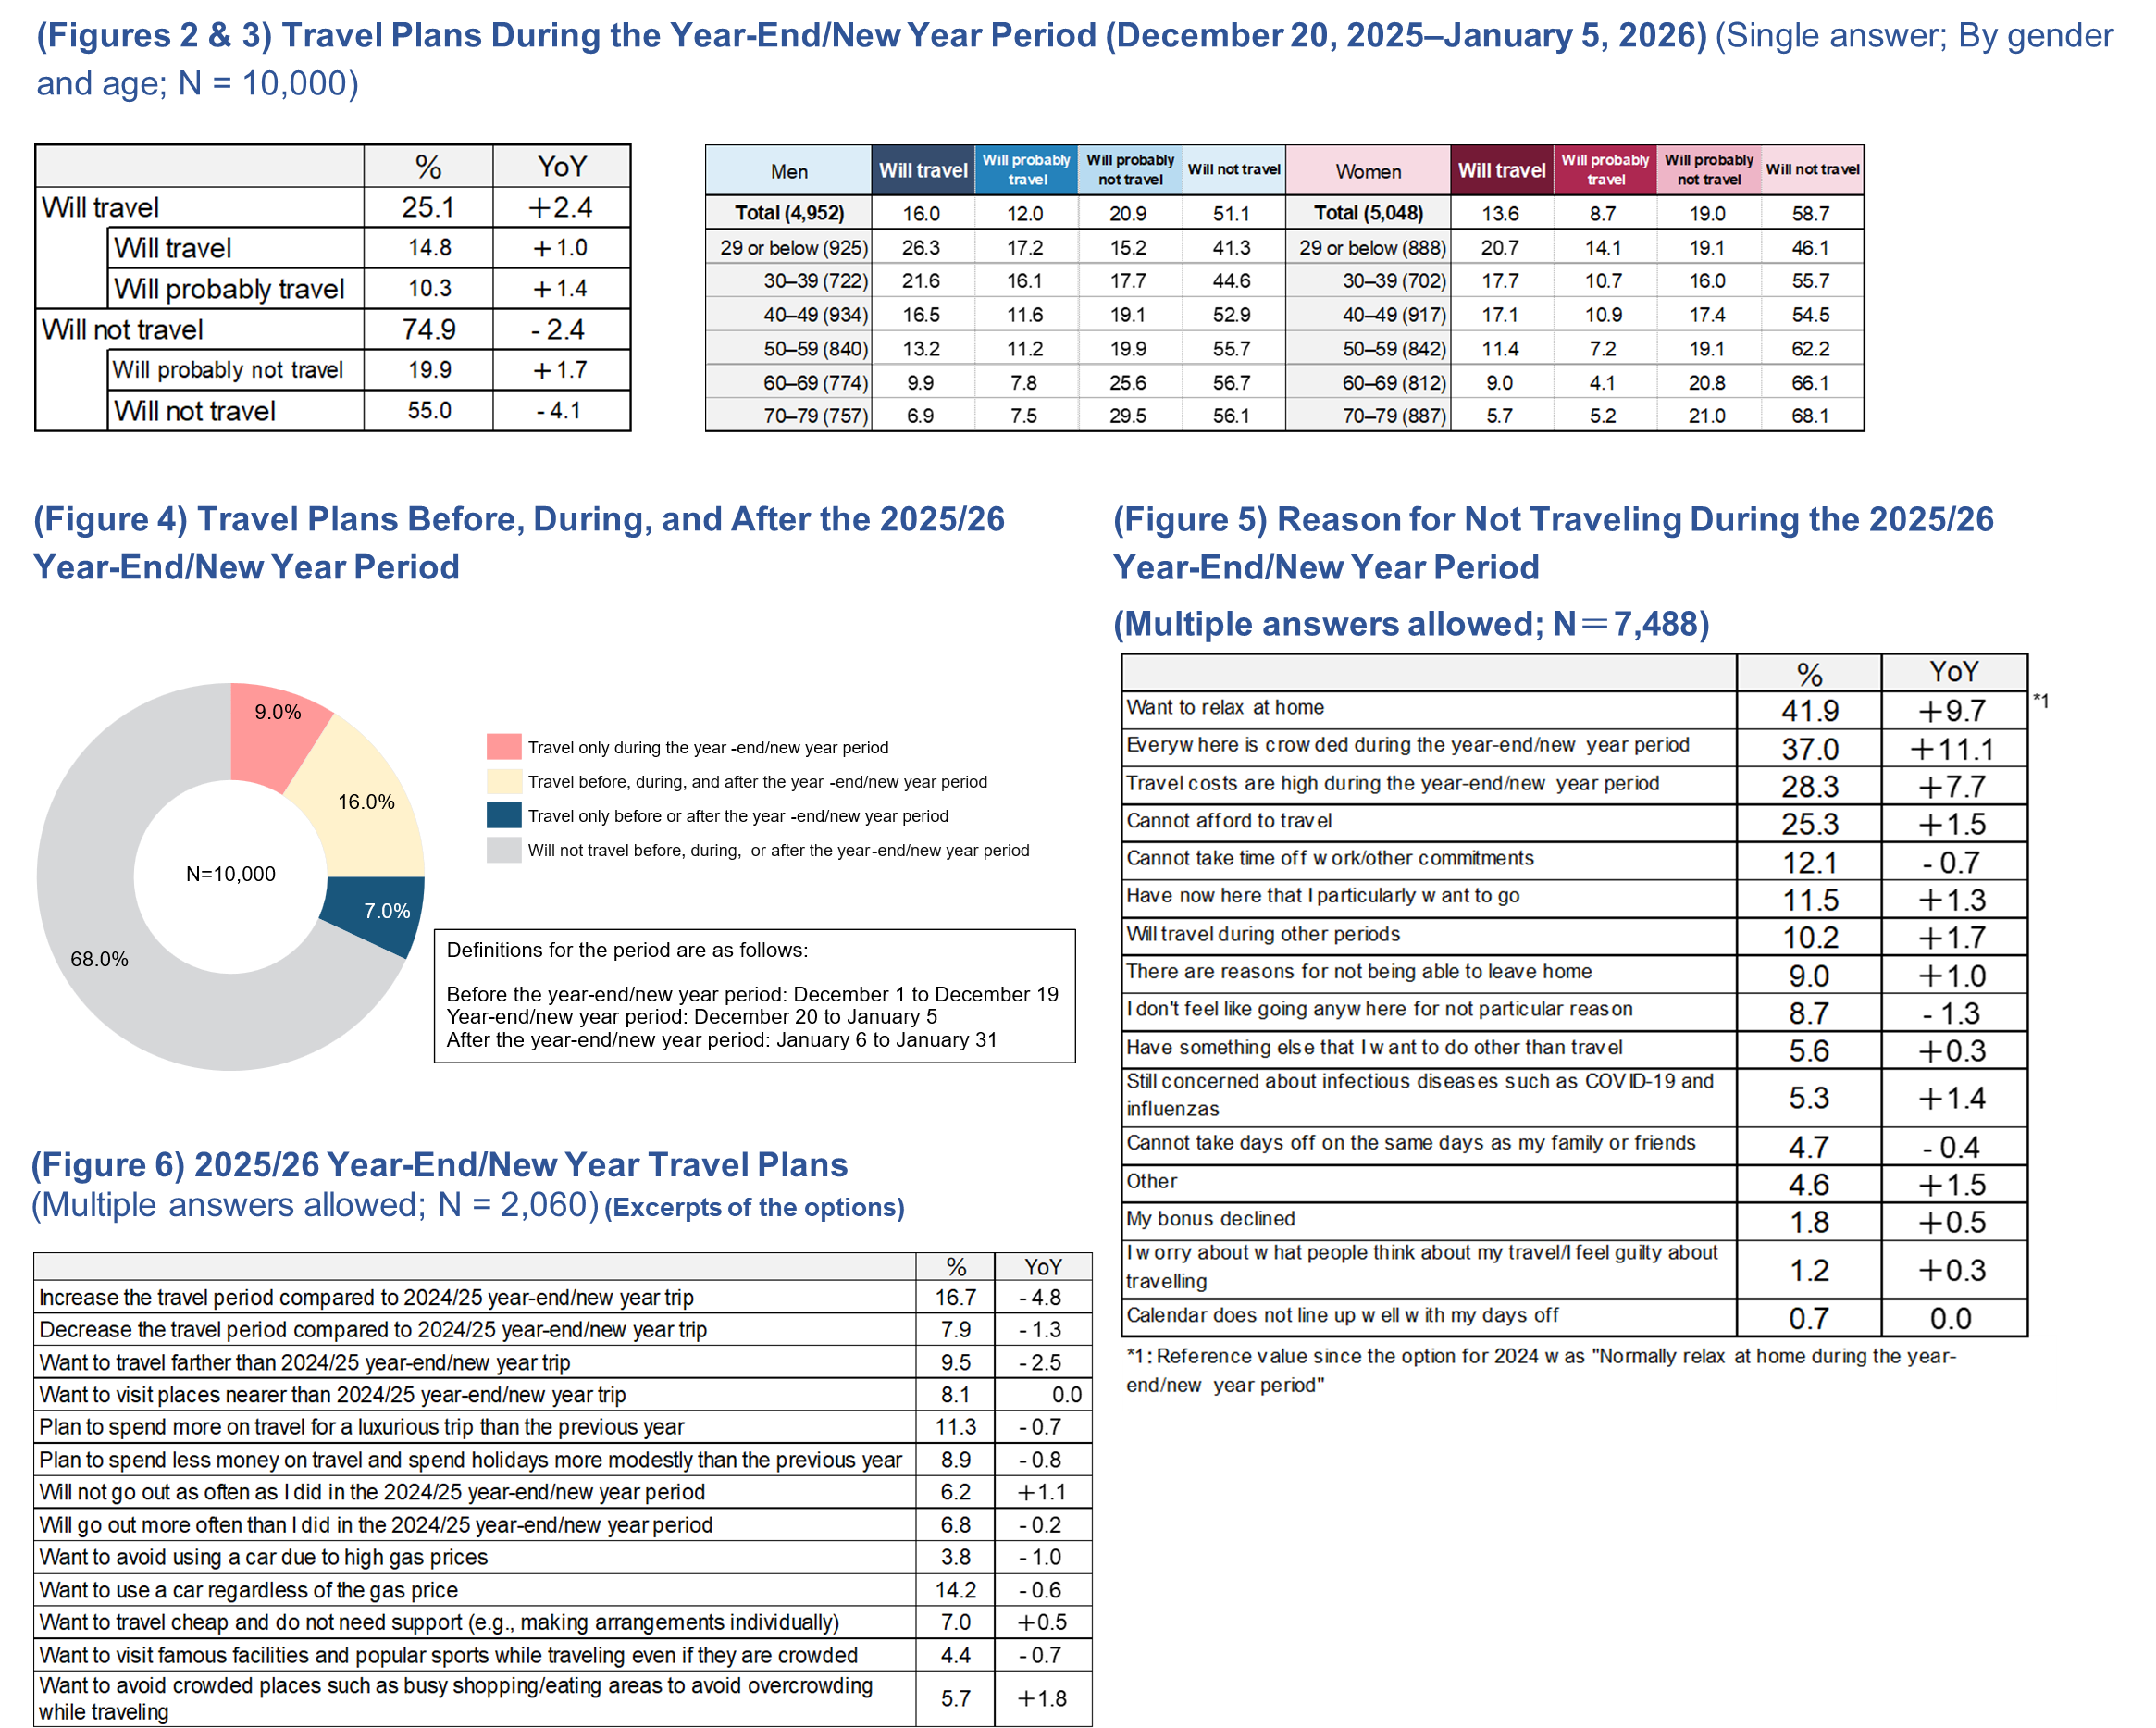
According to the aforementioned survey, the percentage of the respondents who replied they would travel during the 2025/2026 year-end/new year period (total of "Will travel" and "Will probably travel") increased 2.4 pp from a year earlier to 25.1% (Figure 2). By gender and age group, the younger generations tend to be keener on traveling regardless of gender (Figure 3). With respect to the question regarding travel before or after the year-end/new year period, specifically, the period from December 1 to December 19 and the period from January 6 to January 31, 2026, 9.0% answered they would travel only during the year-end/new year period, 16.0% answered "Travel before, during, and after the year-end/new year period," while 7.0% selected "Travel only before or after the year-end/new year period" (Figure 4).
As for reasons for not traveling, the largest number of respondents said they "Want to relax at home during the year-end/new year period (41.9%)," which was up 9.7 pp. The second most popular answer of "Everywhere is crowded during the year-end/new year period (37.0%)" that increased by 11.1 pp year-on-year, was followed by "Travel costs are high during the year-end/new year period (28.3%)," which increased 7.7 pp. Answers backed by the mindset of seeking to relax and avoiding crowds and concerns over spending are ranked at the top. In addition, due to the calendar, "Cannot take time off work/other commitments (12.1%)" declined by 0.7 pp, and "Cannot take days off on the same days as my family or friends (4.7%)" decreased by 0.4 pp. Taking days off or schedule adjustments appear to be less difficult (Figure 5).
With respect to travel plans for the 2025/26 year-end/new year period, the largest percentage of respondents (16.7%) responded to increase their travel period length compared with the same period a year earlier, which was higher than those responding to reduce the travel period length compared with the same period a year earlier (7.9%). However, both answers declined. Furthermore, the number of respondents wanting to travel farther than their trip during the 2024/25 year-end/new year period (9.5%) declined by 2.5 pp. The difference from those wanting to travel to places closer than their trip during the 2024/25 year-end/new year period (8.1%) decreased to 1.4 pp. In addition, the number of respondents for "Want to visit famous facilities and popular spots while traveling even if they are crowded (4.4%)" declined by 0.7 pp while "Want to avoid crowded places such as famous facilities and busy shopping/eating areas to avoid overcrowding while traveling (5.7%)" increased by 1.8 pp. This trend shows that concerns about overtourism are affecting the behavior of travelers (Figure 6).
2.Domestic Travel Trends
The number of domestic travelers is estimated at 38.86 million (102.0% year-on-year), average domestic travel costs at ¥44,000 (102.3% year-on-year), and total domestic travel spending at ¥1.7099 trillion (104.3% year-on-year). Travel costs appear to be increasing partly due to price hikes, but as the 2025/26 year-end/new year period lines up well with the weekends, a slight increase is expected in the number of travelers. Average domestic travel costs are expected to exceed the previous year, which was a record-high, due to the sharp rise in travel related costs primarily because of price hikes, increase in travel demand, recovery of in-bound travel, and manpower shortages in service industries.
We analyzed the travel trend of 1,906 respondents who said they would travel in Japan among the respondents of the main survey of the 2025/26 year-end/new year travel survey (2,060 respondents). Although the 2025/26 year-end/new year period lines up well with the weekends, compared to the previous year, the travel length slightly decreased and trips with their own vehicles and to nearby destinations are trending upward partly due to price hikes and the economic situation. The detailed survey results are as follows.
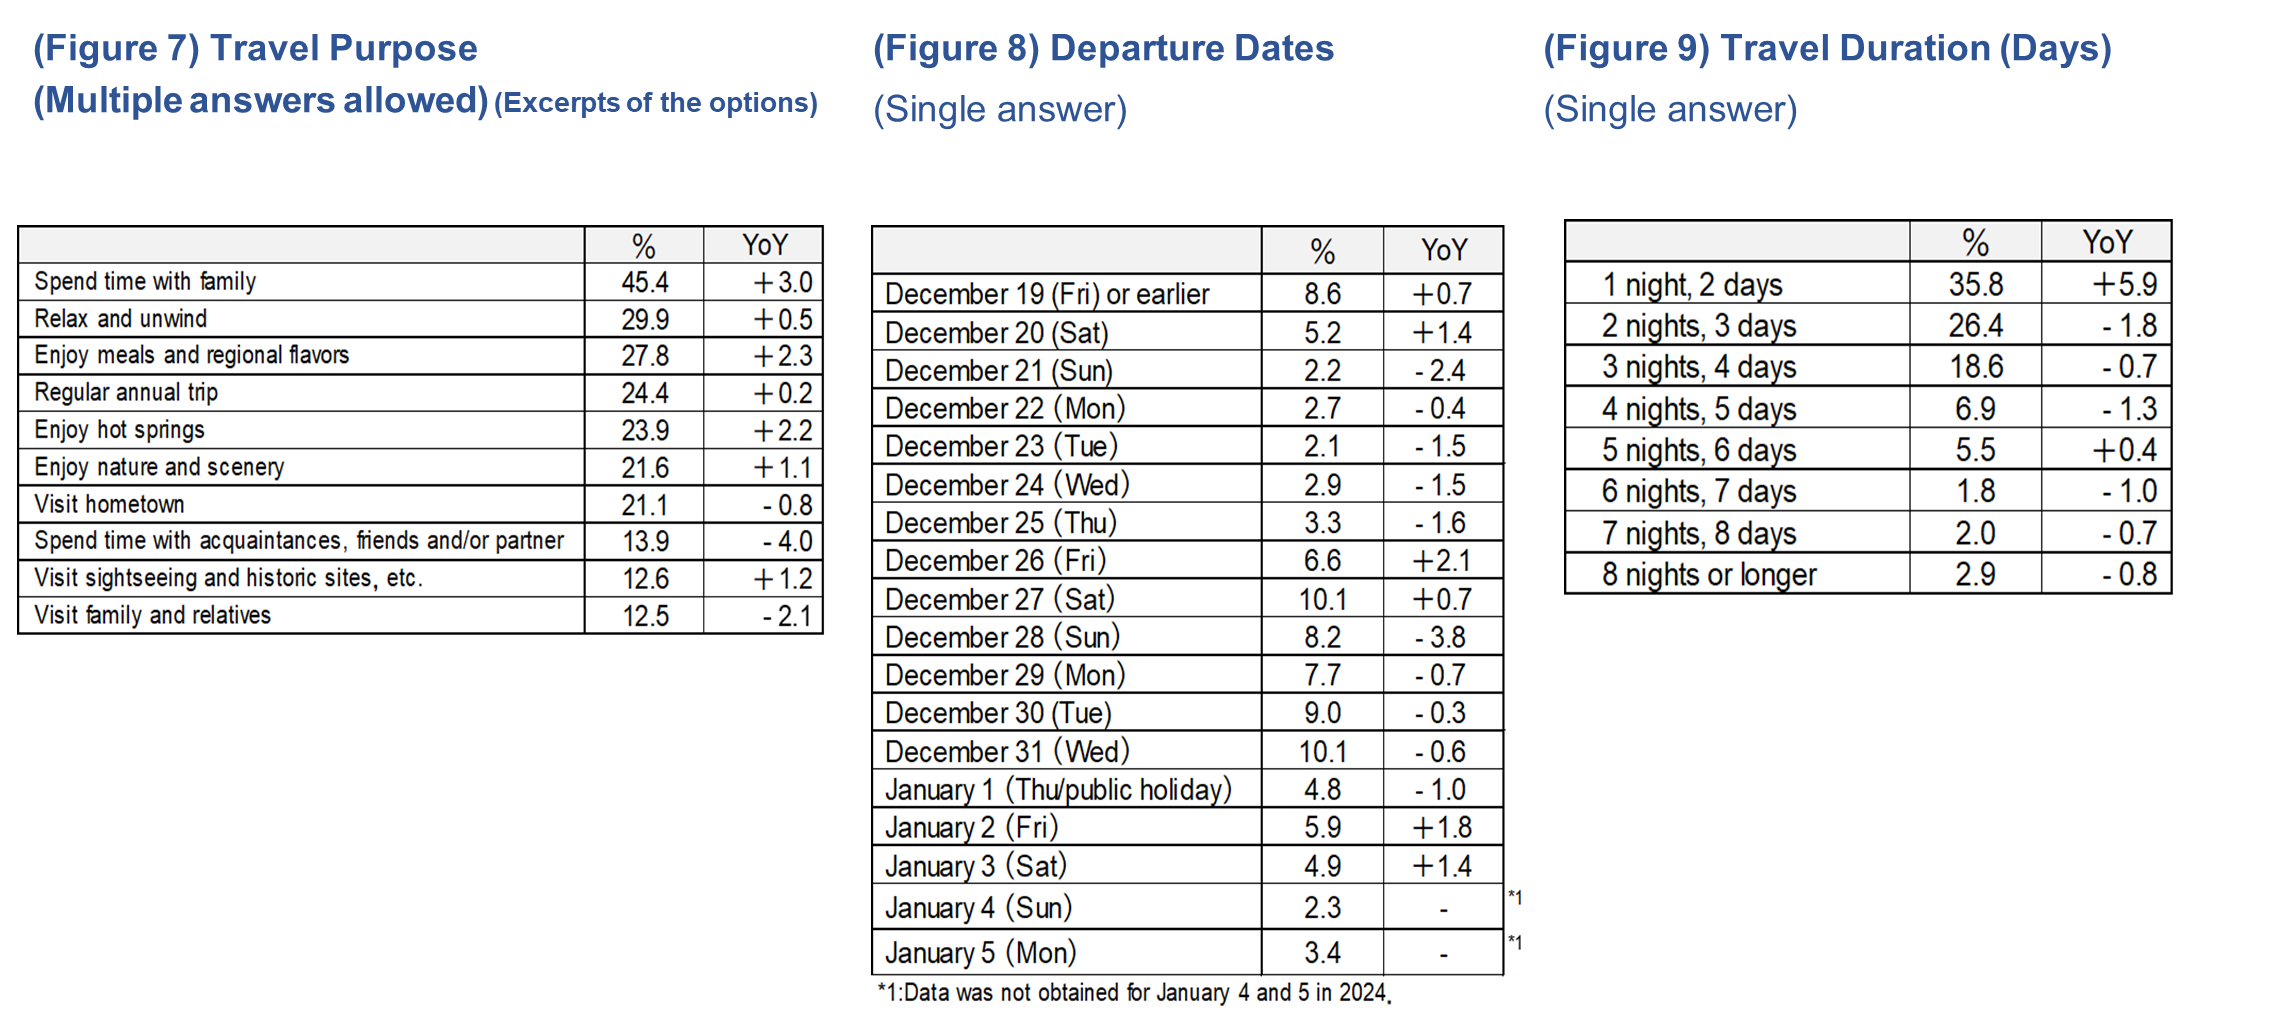
Travel purpose: "Spend time with family" had the largest share at 45.4%, up 3.0 pp year-on-year. This was followed by "Relax and unwind (29.9%)," up 0.5 pp compared to the previous year. On the other hand, "Enjoy meals and regional flavors (27.8%)" increased 2.3 pp, "Enjoy hot springs (23.9%)" went up 2.2 pp, and "Enjoy nature and scenery (21.6%)" grew by 1.1 pp. The results show there is a strong trend of enjoying meals, hot springs, and natural scenery. On the other hand, "Visit hometown (21.1%),""Spend time with acquaintances, friends, and/or partner (13.9%)," "Visit family and relatives (12.5%)" declined 0.8 pp, 4.0 pp, and 2.1 pp, respectively, compared to the previous year (Figure 7).
Departure dates: The popular departure dates are from December 26 to December 31. These days account for 51.8%. In particular, December 27 (Saturday) and December 31 (Wednesday) are the most popular departure dates, accounting for 10.1%. Compared to the previous year, departure dates are not too widespread before December 25 (Thursday) (Figure 8).
Travel duration (days): Overall, the number of respondents who were going to travel for "1 night, 2 days (35.8%)" was the largest, and it increased by 5.9 pp from a year earlier. Price hikes and concerns over uncertainty in the future could be factors. The number of those traveling for "5 nights, 6 days (5.5%)" increased by 0.4 pp partly because the 2025/26 year-end/new year period lines up well with the weekends. However, overall, the trend of reducing travel duration is noticeable (Figure 9).
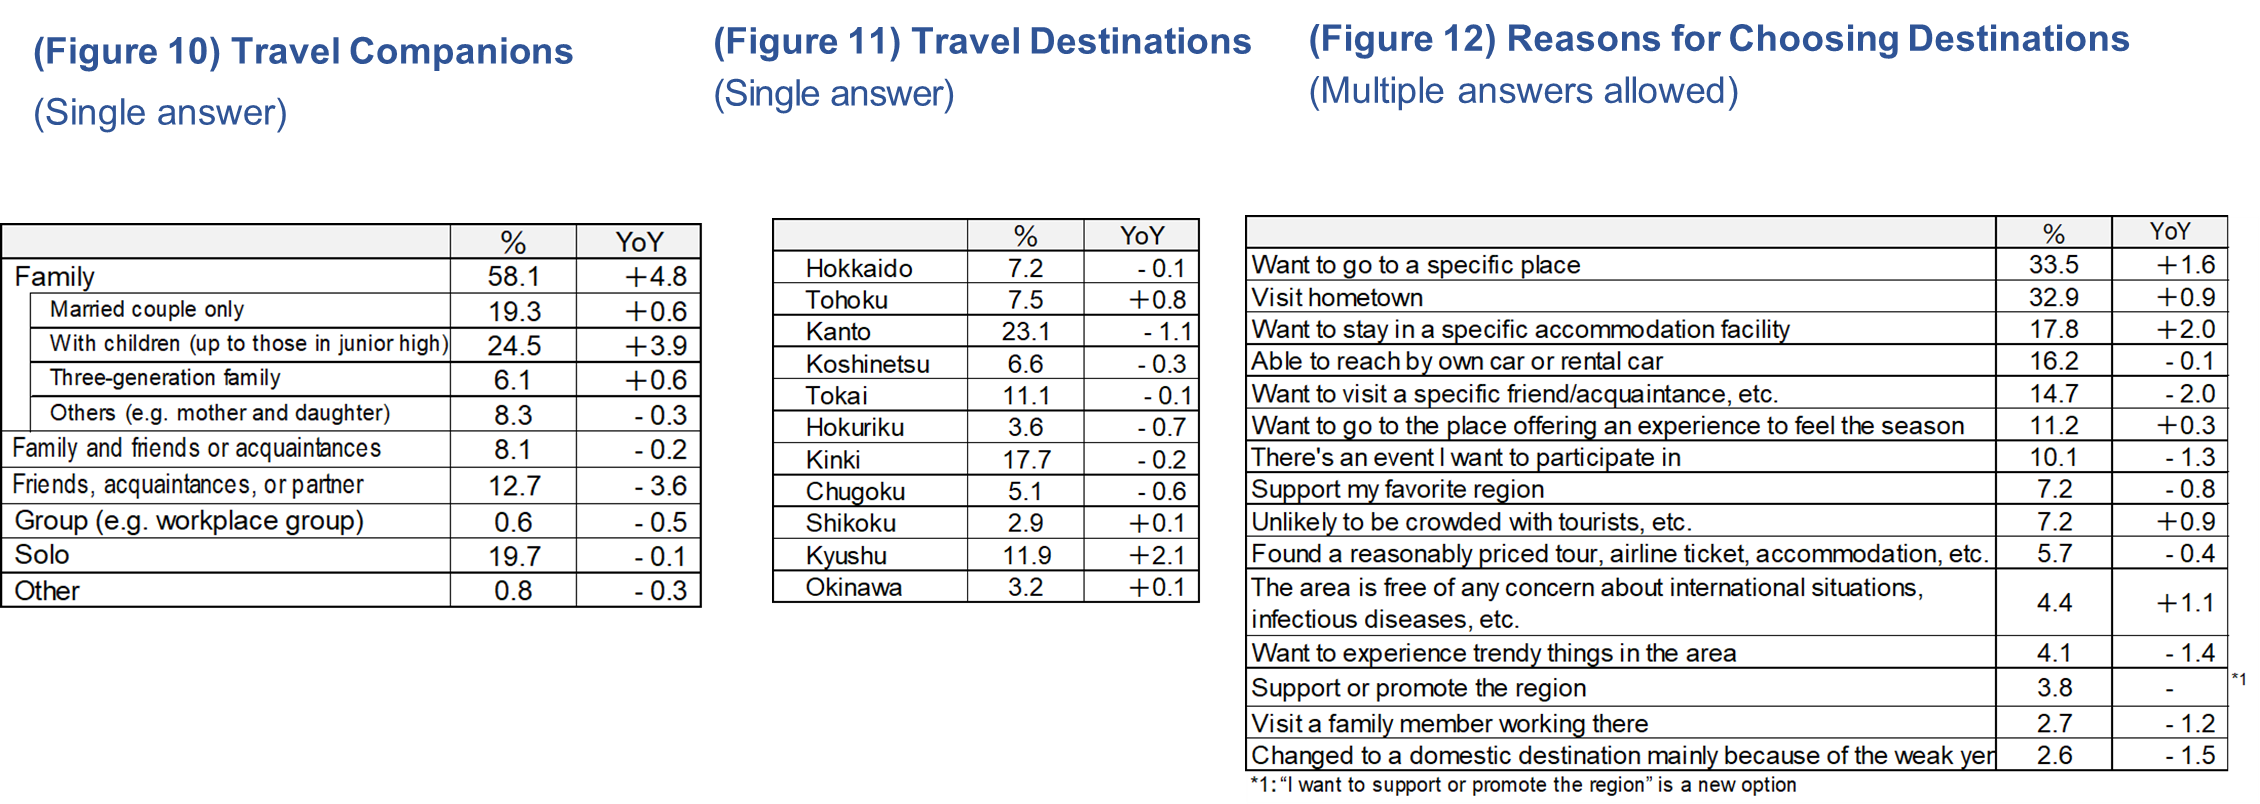
Travel companions: The respondents going on a family trip with children (up to those in junior high) was the largest at 24.5%, up by 3.9 pp. "Solo trip (19.7%)" and "Married couple only (19.3%)" are the second and third most popular choices. Family trips overall increased by 4.8 pp. On the other hand, "Friends, acquaintances, or partner (12.7%)" declined by 3.6 pp. It is believable that less financial leeway is making going on trips with friends difficult and is making more people choose to spend time with family (Figure 10).
Travel destinations: "Kanto (23.1%)" was the most popular destination, followed by "Kinki (17.7%)" and "Kyushu (11.9%)" (Figure 11). As for the reasons for choosing these destinations, the largest percentage of respondents said, "Want to go to a specific place (33.5%)," which went up by 1.6 pp. The second and third most popular reasons were "Visit hometown (32.9%)" and "Want to stay in a specific accommodation facility (17.8%)." "Unlikely to be crowded with tourists, etc. (7.2%)" increased by 0.9 pp. "The area is free of any concern about international situations, infectious diseases, etc. (4.4%)" increased by 1.1 pp. The results show there is a trend of placing value on comfort and security in addition to purpose (Figure 12).
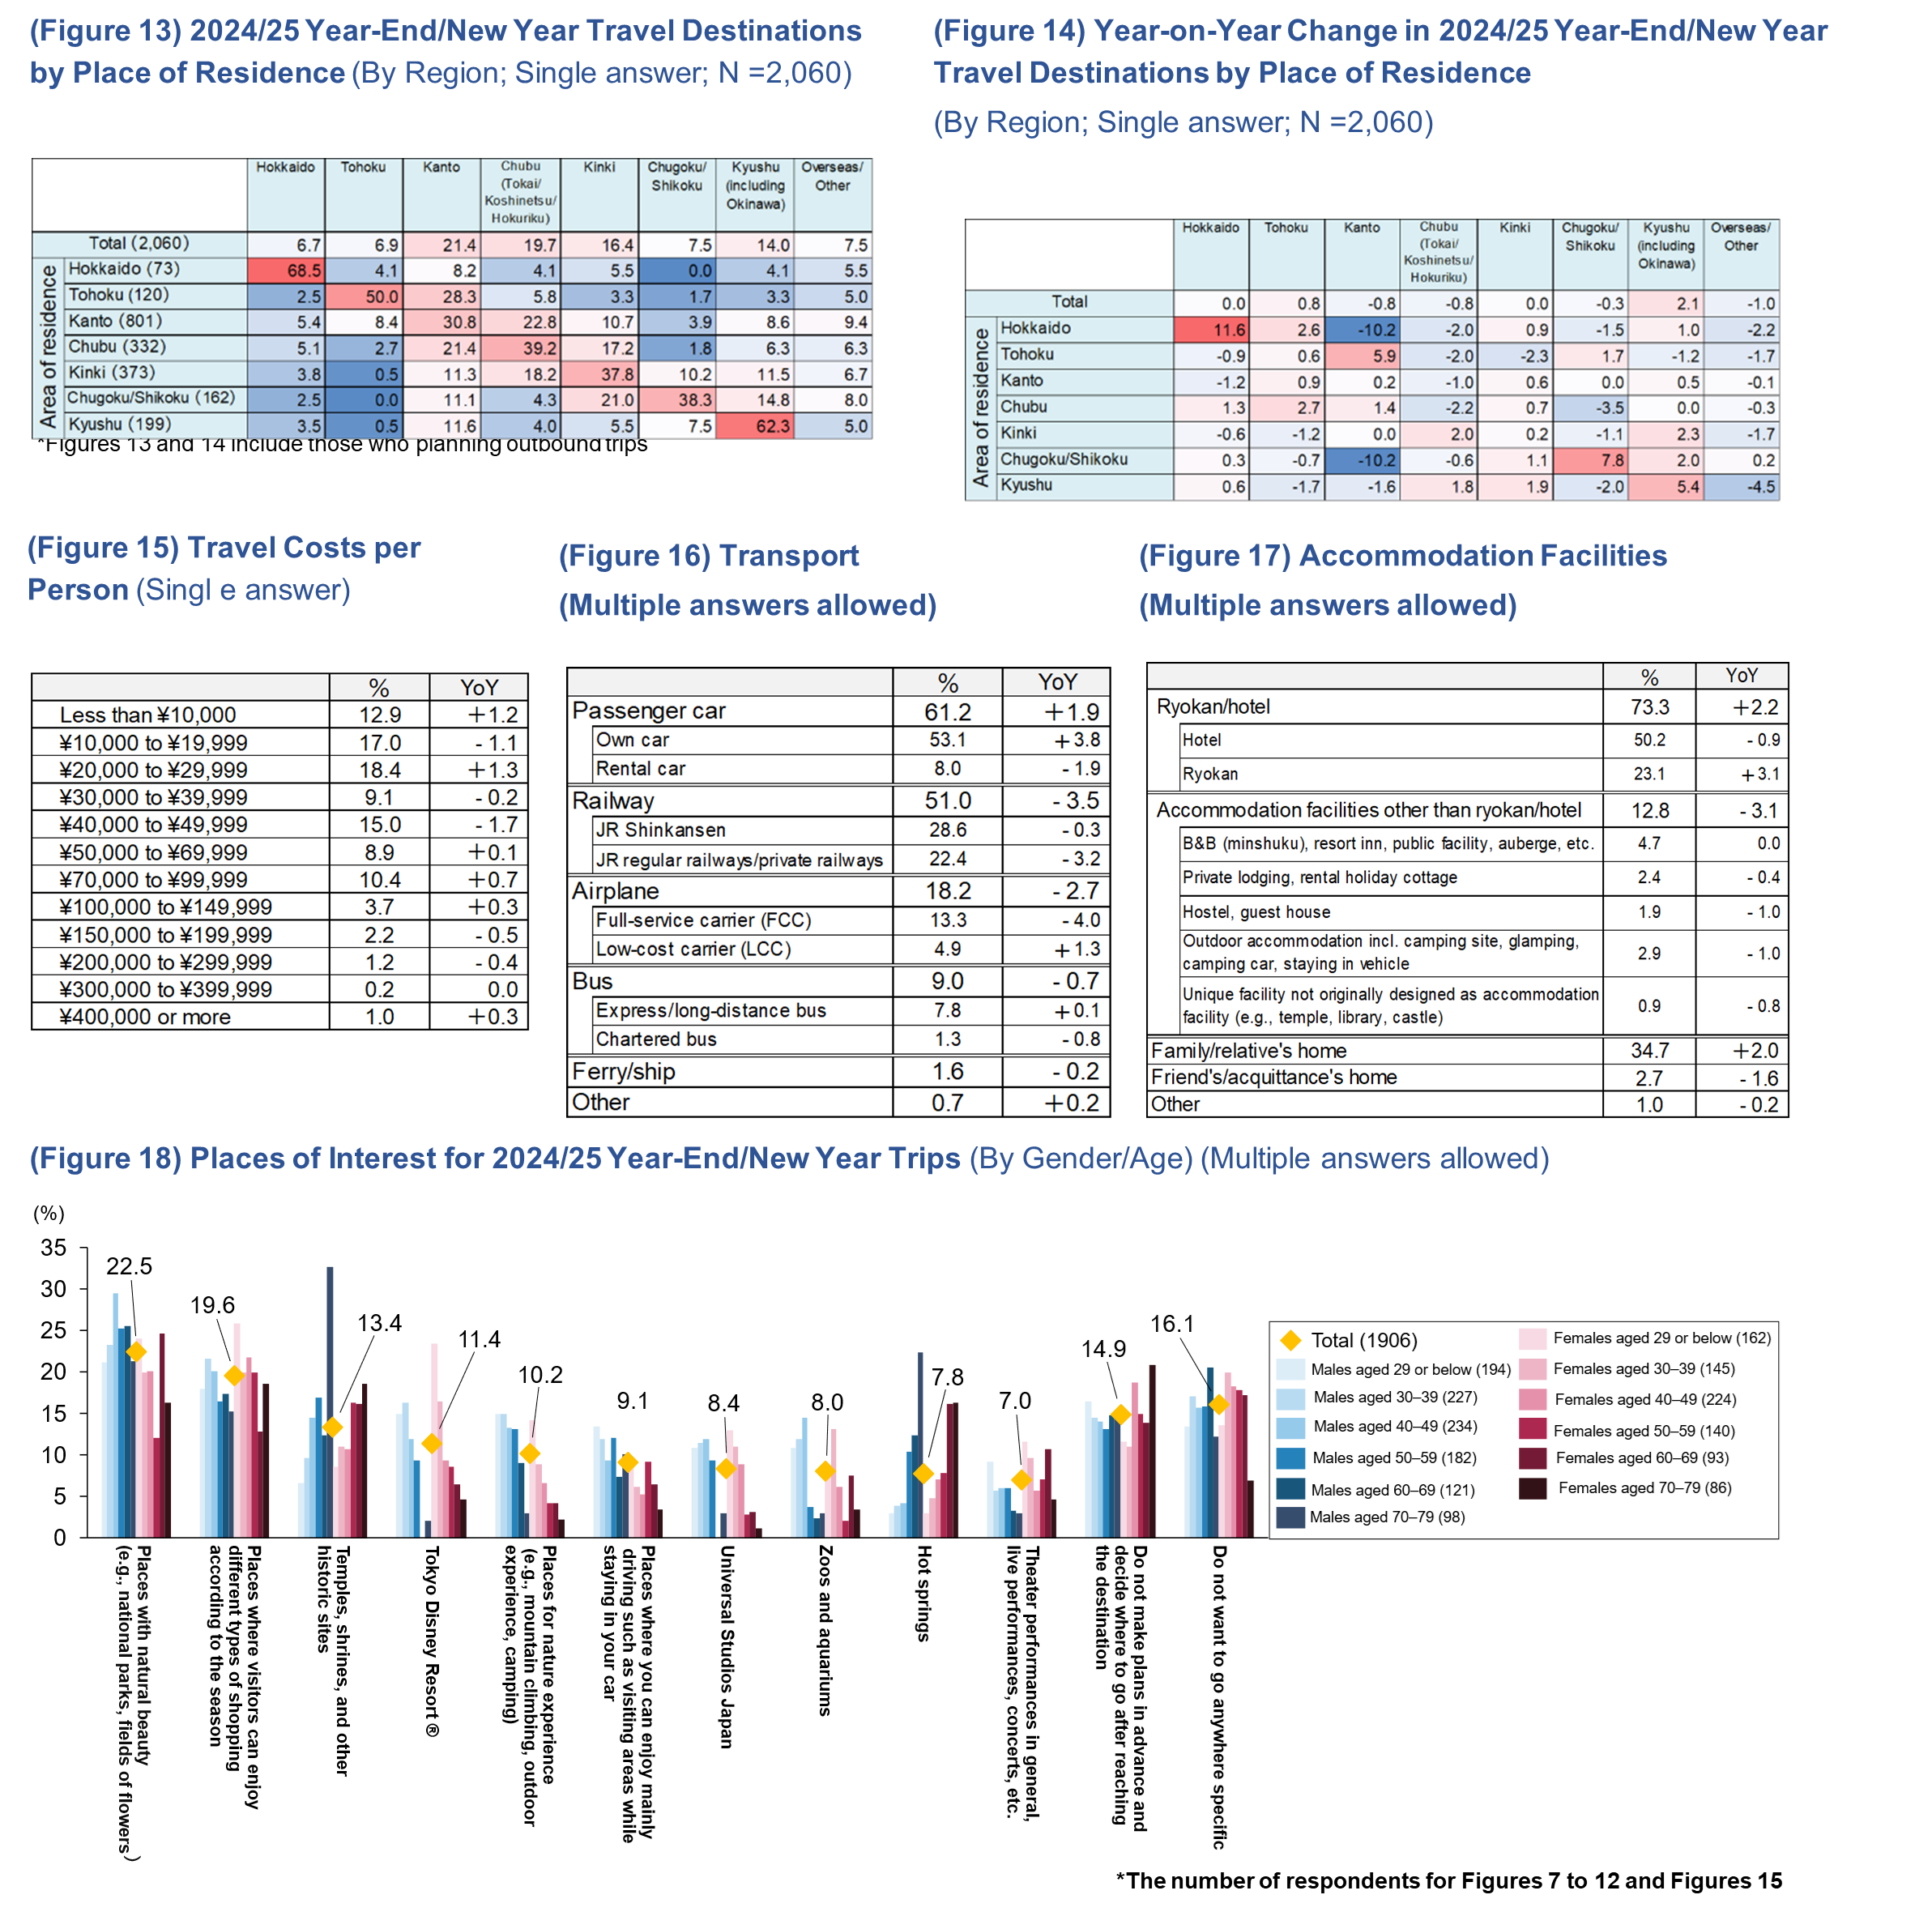
Looking at travel destinations by place of residence, scores for intra-regional travel, i.e., destinations and places of residence are in the same regions, are high in three regions in the order of "Hokkaido (68.5%)," "Kyushu (62.3%)," and "Tohoku (50.0%)" (Figure 13). Compared to the previous year, the percentage of intra-regional travel increased in all areas except for Chubu. In particular, a significant increase is seen in Hokkaido that grew by 11.6 pp and Chugoku/Shikoku that went up by 7.8 pp (Figure 14).
Travel costs per person: Overall, the number of respondents spending "¥20,000 to ¥29,999" is the largest at 18.4%, increasing 1.3 pp from a year earlier. Those spending "¥10,000 to ¥19,999" at 17.0%, which fell by 1.1 pp from a year earlier. Those spending "¥40,000 to ¥49,999 (15.0%)" decreased by 1.7 pp. On the other hand, the percentages of those spending "Less than ¥10,000 (12.9%)" was up by 1.2 pp year-on-year and "¥70,000 to ¥99,999 (10.4%)" grew by 0.7 pp year-on-year. It can be said that the results show travel costs are diverse depending on the travel format and destination (Figure 15).
Transport: The number of respondents using "Own car" was the largest at 53.1% and rose by 3.8 pp year-on-year. The next most popular answer is "JR shinkansen" at 28.6%, down by 0.3 pp compared to the previous year, followed by "JR regular railways/private railways (22.4%, down by 3.2 pp)," "Full-service carrier (13.3%, down by 4.0 pp)," and "Rental car ( 8.0%, down by 1.9 pp)." There was a decrease in the use of all modes of transport compared with a year earlier. This indicates an increase in short-term trips to nearby locations by using one's own car (Figure 16).
Accommodation facilities: The number of respondents staying in "Hotels" was highest at 50.2%, down 0.9 pp, followed by "Family/relative's home" at 34.7%, up 2.0 pp, and "Ryokan" at 23.1%, up by 3.1 pp. The results show that travel purpose options with a significant increase such as "Spend time with family," "Enjoy meals and regional flavors," and "Enjoy hot springs" also affect the choice of accommodation facilities (Figure 17).
As for the places of interest, the largest percentage of respondents chose "Places with natural beauty (e.g., national parks, fields of flowers) (22.5%)," followed by "Places where visitors can enjoy different types of shopping according to the season (19.6%)", and "Temples, shrines, and other historical sites (13.4%)" (Figure 18).
Popular destinations in the bookings of JTB's domestic products are Okinawa where JUNGLIA OKINAWA, a theme park, was opened in July 2025, Tokyo including Tokyo Disney Resort®, and Kansai including Universal Studios Japan. Trips to more distant destinations by plane such as Hokkaido and Kyushu are also popular.
3.Overseas Travel Trends
The estimated number of Japanese outbound travelers is one million people (131.5% year-on-year). The average outbound travel costs are estimated at ¥275,000 (108.7% year-on-year), which is the highest since 2000. Total outbound travel spending is at ¥275.8 billion (142.9% year-on-year). Since the 2025/26 year-end/new year period lines up well with the weekends, short travel lengths declined from the previous year. Destinations relatively close to Japan such as South Korea and Taiwan are less popular while Hawaii and Europe that are relatively far from Japan are more in demand.
Of the 2,060 respondents participating in this survey, 154 people said that they will travel overseas during the 2025/26 year-end/new year period. The number of respondents traveling for "3 nights, 4 days" was the largest at 20.8%, but this number dropped by 4.7 pp. "4 nights, 5 days (18.2%, up 3.4 pp year-on-year)," "8 nights or longer (14.9%, down 1.2 pp year-on-year)," and "6 nights, 7 days (14.3%, up 5.6 pp year-on-year)," and "5 nights, 6 days (11.7%, 2.3 pp year-on-year)" follow. The total number of respondents who selected 3 nights, 4 days or shorter declined by 8.5 pp while travel that are 7 nights, 8 days or longer also decreased. It can be said that medium-length trips such as 4 to 6 nights are on the rise. The most popular destination is "South Korea (19.5%)," but it declined by 6.7 pp. "Hawaii (16.9%, up 6.8 pp year-on-year)," "Europe (16.2%, up 5.5 pp year-on-year)," and "Southeast Asia (11.0%, up 1.6 pp year-on-year)" are the next most popular options. More respondents selected these destinations compared to the previous year. As for travel costs per person, the number of respondents spending "¥400,000 or more (20.1%, up 2.7 pp year-on-year)" was the largest, followed by those spending "¥100,000 to ¥149,999 (15.6%, up 2.8 pp year-on-year)," and "¥300,000 to ¥399,999 (13.0%, up 6.3 pp year-on-year)." All these options grew. The total of ¥200,000 or more increased by 11.3 pp compared to the previous year. Longer travel lengths and increase in demand for farther destinations appear to have led to an increase in budgets (Figures 19, 20, 21, and 21).
Popular destinations for the bookings of JTB's outbound products are Hawaii, Taiwan, and Guam. Partly due to the opening of the Grand Egyptian Museum (GEM), which officially opened on November 1, 2025, Egypt is more popular than usual.
The survey also questioned future outbound travel intentions of the participants of the preliminary survey including those who were not planning to travel during the 2025/26 year-end/new year period. In terms of the timing of travel by destination, the number of those who "Want to go immediately" was the highest for "Hawaii" at 10.6%, followed by 10.5% for "Europe" and 8.9% for "Australia/New Zealand." Relatively distant destinations tend to be ranked at the top. Both "South Korea" and "Taiwan" came next at 8.6%. The result shows a clear trend in the division between distant and close destinations (Figure 23).
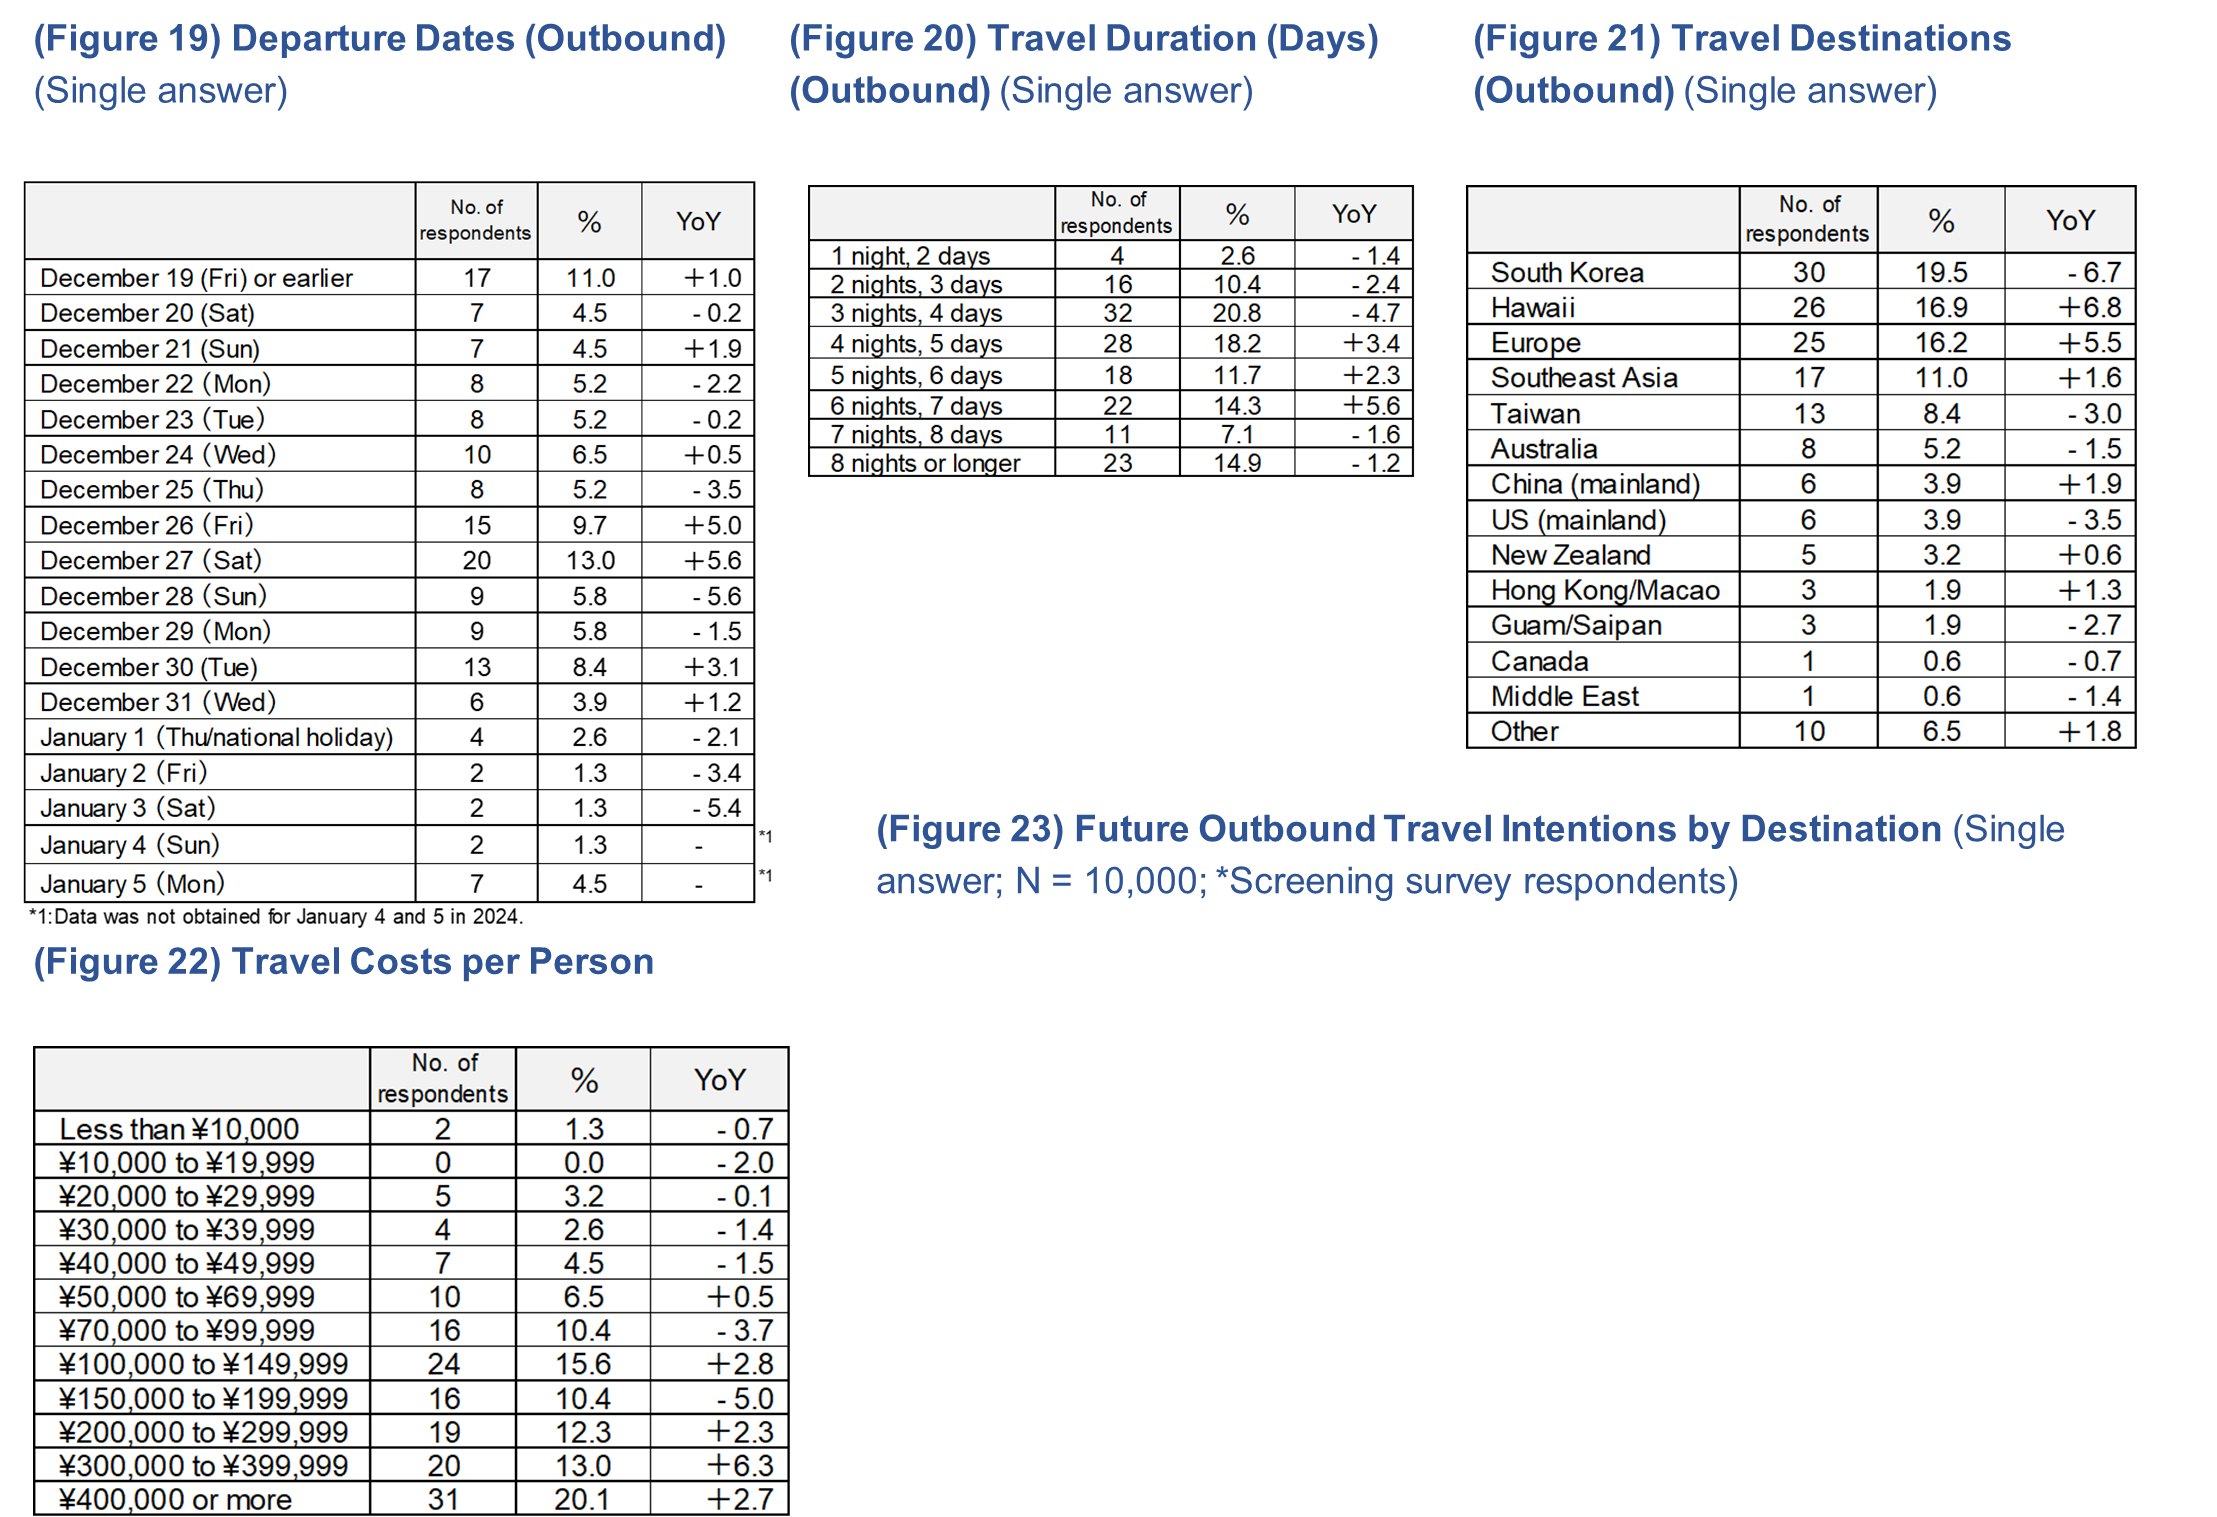
*The number of respondents for Figures 19 to 22 are 154
4. Economic Environment and Consumer Sentiment Concerning Travel and Leisure Spending
The Japanese economy remains uncertain due to the impact of the unstable global climate, price hikes and upward trend of interest rates in Japan and overseas, and weaker yen in currency exchange although the Japanese economy has continuously been on track for a recovery. The Gross Domestic Product (GDP) in Japan for July to September, which was announced by the Cabinet Office on November 17, 2025, shrank 0.4% compared to the April to June period. Consequently, the Japanese economy grew negatively for the first time in 18 months. The Nikkei Index has been on the rise since April 2025 and exceeded ¥50,000 as of the end of October 2025. Since then, the Nikkei Index has settled down. The Japanese government maintained the assessment in its Monthly Economic Report for October 2025 that "The Japanese economy is recovering at a moderate pace, while the effects caused from the US trade policies are seen mainly in the automotive industry." According to the assessment, a moderate recovery is expected, while continued attention should be given to downturn risks of the Japanese economy due to the impact of the US trade policies, the effects of continued price increases on private consumption, and the effects of fluctuations in the financial and capital markets.
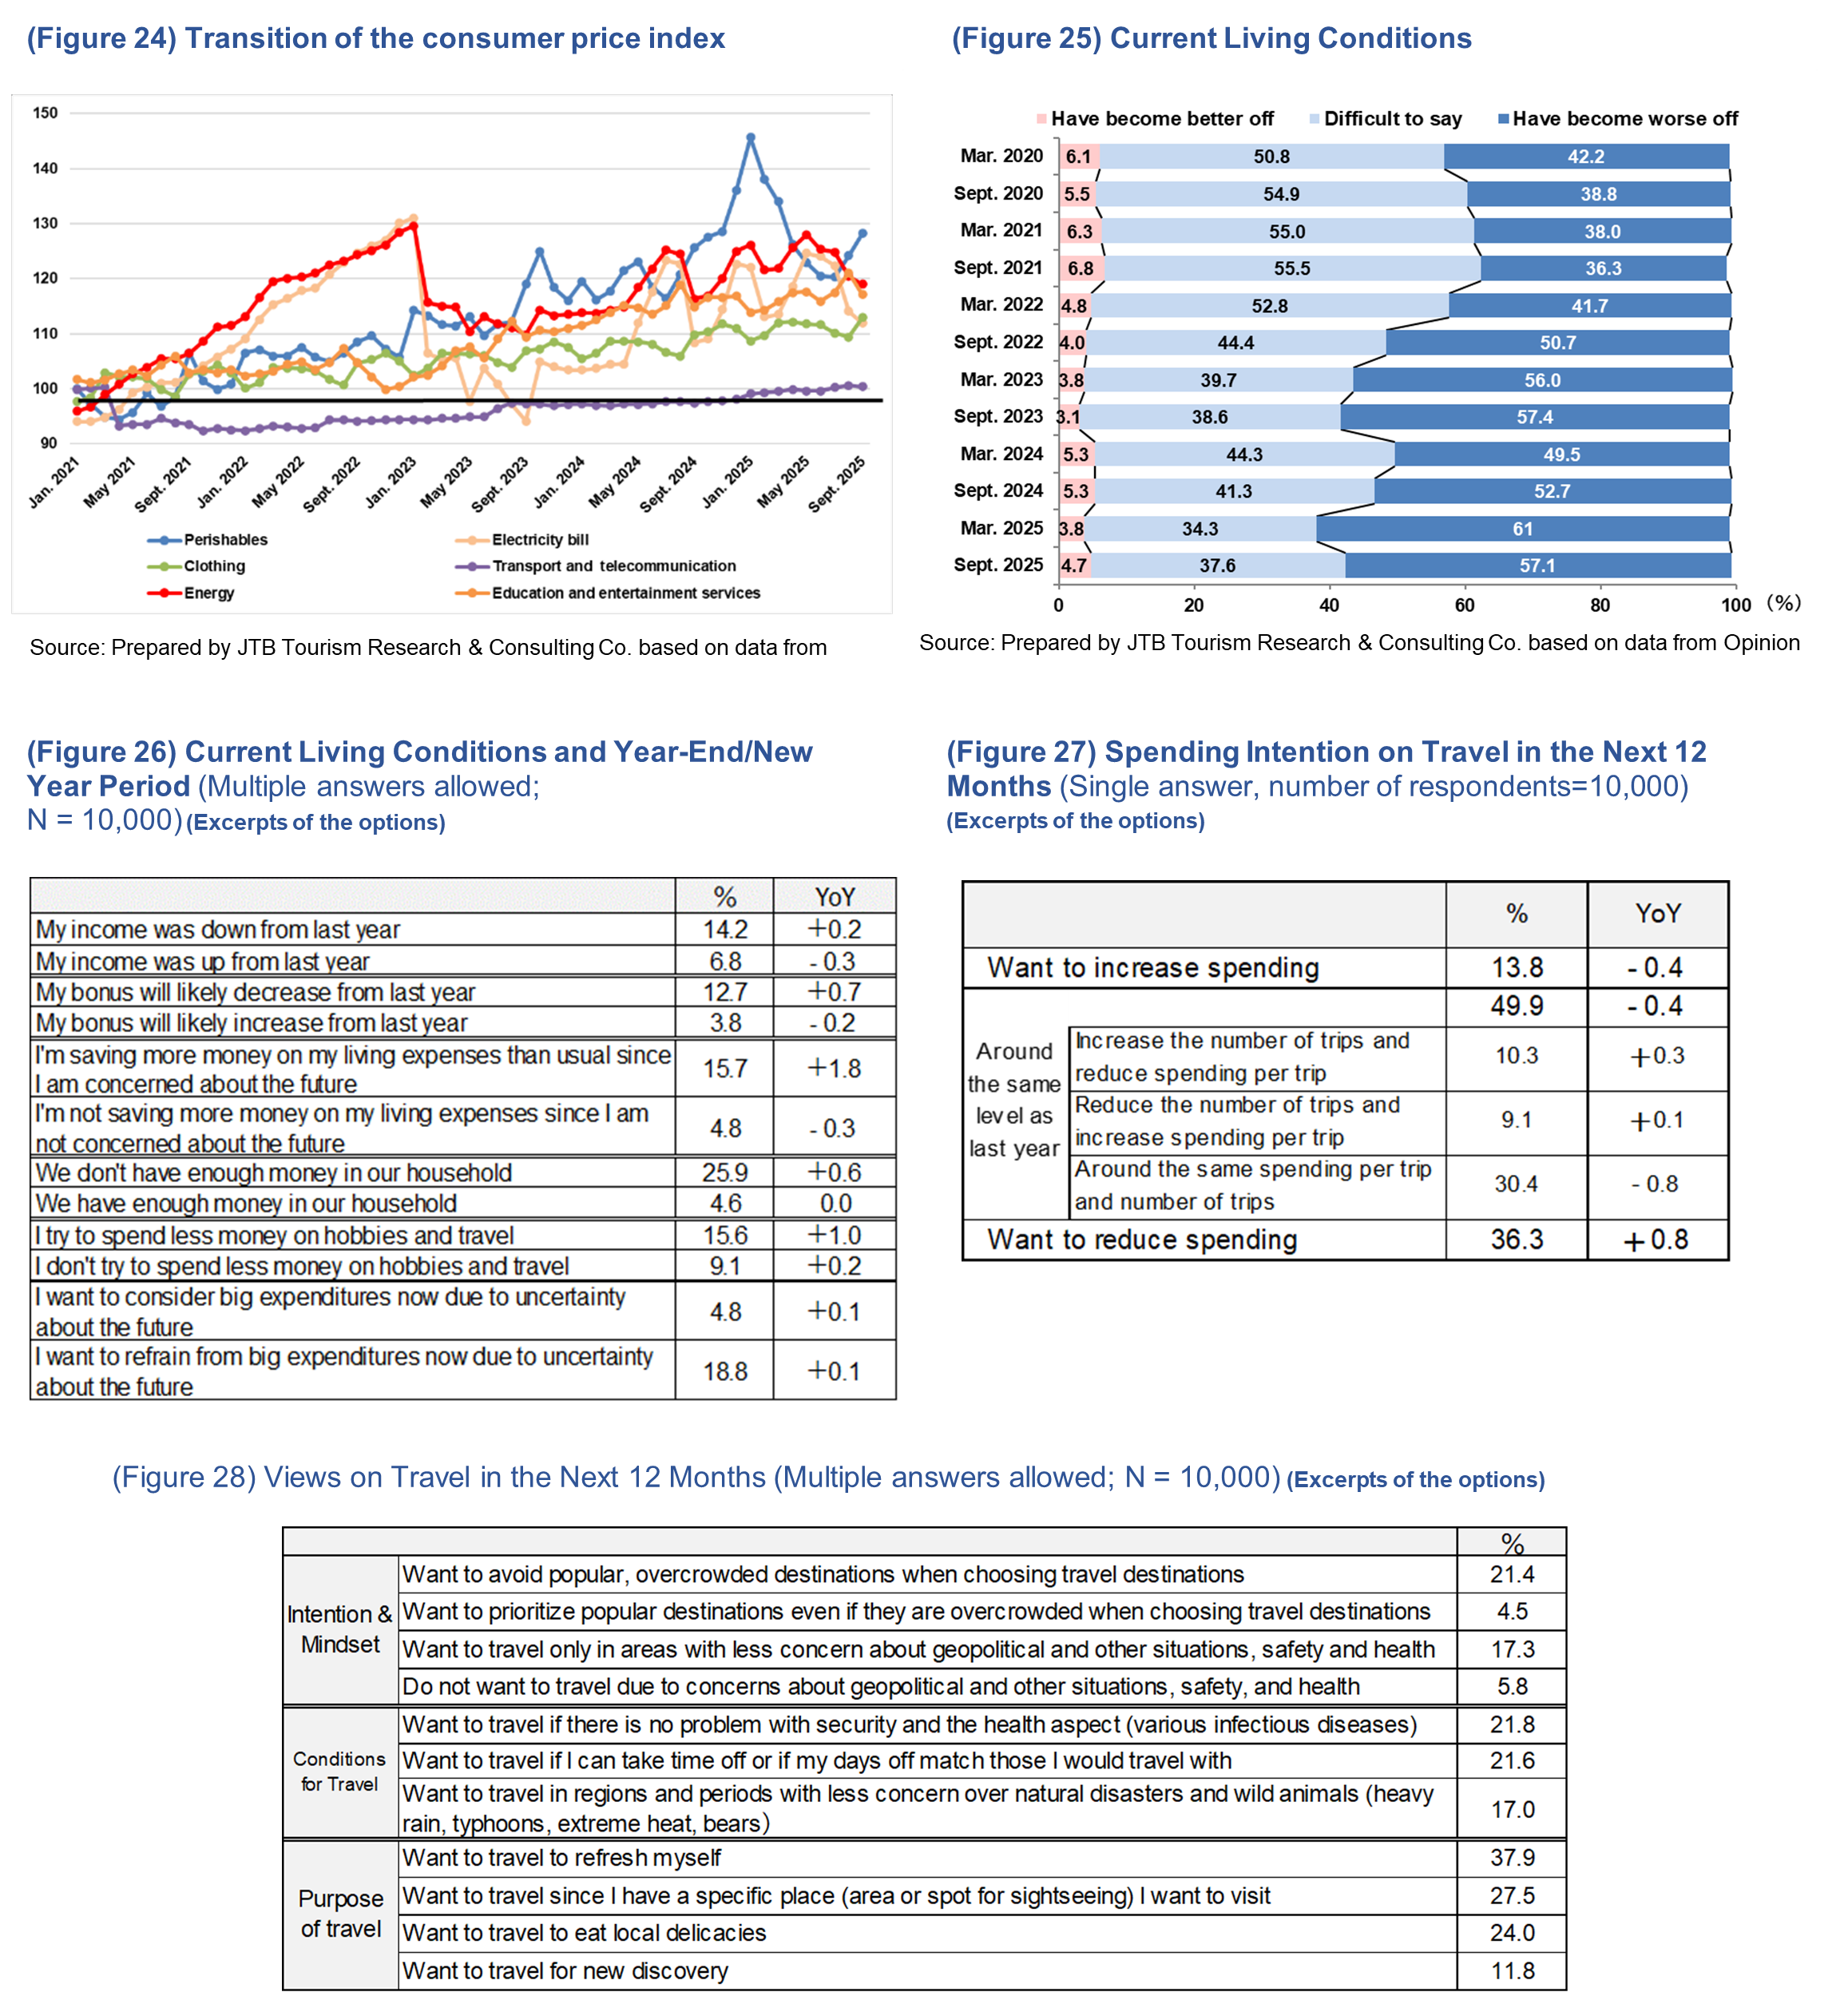
Looking at consumer price indexes for major items, a continued upward trend is observed for prices for daily necessities starting with "Perishables" (Figure 24). As for the wages and consumption trend, real wages continued to be negative for nine consecutive months as of September 2025. According to the "Impression of Present Household Circumstances" section of the Bank of Japan's "Opinion Survey on the General Public's Views and Behavior," the proportion of respondents who said they "Have become worse off" seems to be increasing in the long term since 2021 (Figure 25).
Respondents were also asked about their life for this year-end/new-year period. As a result, "My income was up from last year (6.8%)" and "My bonus will likely increase from last year (3.8%)" decreased from the previous year. "My income was down from last year (14.2%)," "My bonus will likely decrease from last year (12.7%)," and "We don't have enough money in our household (25.9%)" respectively increased. The results show a decline in income. In addition, "I try to spend less money on hobbies and travel (15.6%)" exceeded "I don't try to spend less money on hobbies and travel (9.1%)" by 6.5 pp. Moreover, "I want to refrain from big expenditures now due to uncertainty about the future (18.8%)" exceeded "I want to consider big expenditures now due to uncertainty about the future (4.8%)" by 14 pp. The impact of the decline in income on consumer sentiment is noticeable (Figure 26).
On travel spending in the next 12 months, both maintaining spending at the same level (49.9%) or increase spending (13.8%) respectively declined slightly compared to the previous year. There is no significant change, but relatively cost-minded spending is seen for travel as well (Figure 27). On their view about traveling in the next 12 months, the most popular answer was "Want to avoid popular, overcrowded destinations when choosing travel destinations (21.4%)," followed by "Want to travel only in the areas with less concern about geopolitical and other situations, safety, and health" at 17.3%. For conditions of travel, "Want to travel if there is no problem with security and the health aspect (various infectious diseases)" was 21.8%, followed by "Want to travel if I can take time off or if my days-off match those I would travel with" at 21.6%. Those who selected "Want to travel in regions and periods with less concern over natural disasters or wild animals" accounted 17.0%. Awareness to avoid risk such as overtourism, infectious diseases, political climate as well as natural disasters and wild animals seems to be more important in the future selection of travel destinations (Figure 28).
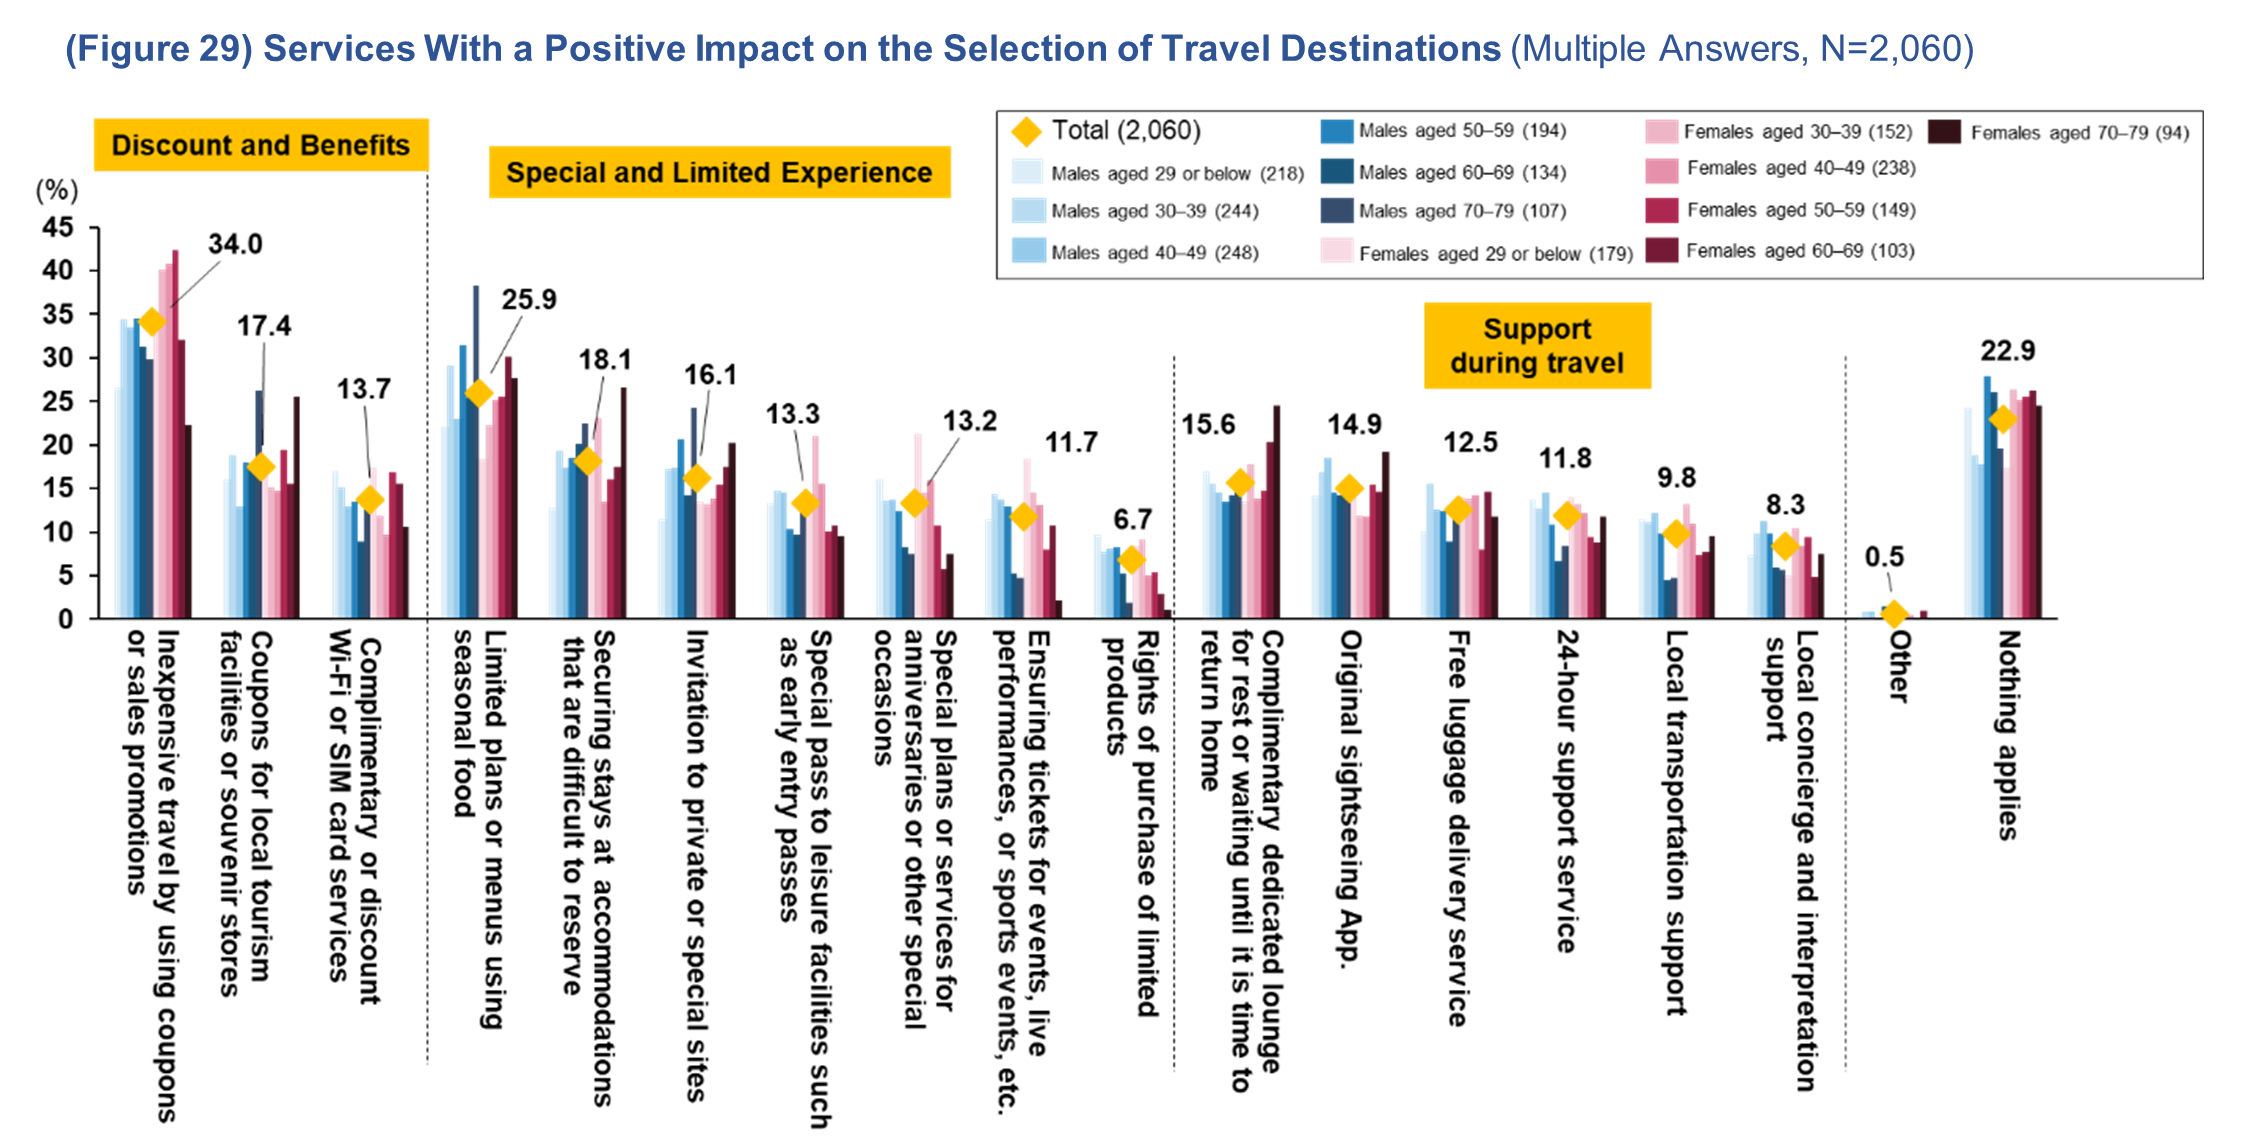
Lastly, the main survey participants responding "Will travel" during the 2025/26 year-end/new year period in the preliminary survey were asked about services that positively affect the choice of travel destinations. Partly due to the economic situation such as price hikes, the most popular answer was "Inexpensive travel by using coupons or sales promotions (34.0%)." Creative measures to reduce prices seem to be a catalyst for travel. On the other hand, "Limited plans or menus using seasonal food (25.9%)," "Securing stays at accommodations that are difficult to reserve (18.1%)," and "Invitation to private or special sites (16.1%)" are popular. This trend indicates that people value unique experiences and content only available at the site in addition to prices and convenience. Rarity and uniqueness are becoming important factors in travel choices (Figure 29).
[2025/26 year-end/new year travel survey: Survey Method]
Survey period: November 11 to 13, 2025
Participants: Individuals aged 15 to 79 living in Japan
Number of samples: Preliminary survey 10,000; main survey 2,060
(The participants of the main survey were selected from those who had responded "Will travel" or "Will probably travel" during the 2025/26 year-end/new year period in the preliminary survey.)
Survey subject: Overnight or longer trips scheduled between December 20, 2025, to January 5, 2026
(Domestic travel is limited to those for the purpose of sightseeing or hometown visits, while outbound travel includes business travel.)
Survey method Online survey
*Because the survey results are rounded, there could be discrepancies in the sub-totals or
differences with the previous year's figures.
―――――――――――――――――――――――――――――――――――――――――
Contact for press inquiries:
JTB Corp. Branding & Communication Team (Public Relations)
Phone: +81 3 5796 5833
(Figure 30) Estimated Number of Travelers/Travel Costs for the Year-End/New Year Period