2023年夏休み(7月15日~8月31日)の旅行動向
株式会社JTB
●国内旅行者数は7,250万人、対前年116.9%、コロナ禍前と同水準まで回復
●海外旅行者数は120万人、対前年214.3%
●海外旅行は短期傾向、ハワイ・韓国・台湾方面から回復
JTBは、「夏休み(7月15日~8月31日)に、1泊以上の旅行に出かける人」の旅行動向見通しをまとめました。本レポートは、各種経済指標、業界動向や交通機関各社の動き、宿泊施設の予約状況、各種意識調査などをもとに算出したもので、1969年から発表し、今年で54回目となります。なお2022年は新型コロナウイルス感染症対策として、出入国に関する水際対策が実施されており、海外旅行平均費用および海外旅行消費額は発表しておりませんでした。調査結果は以下のとおりです。
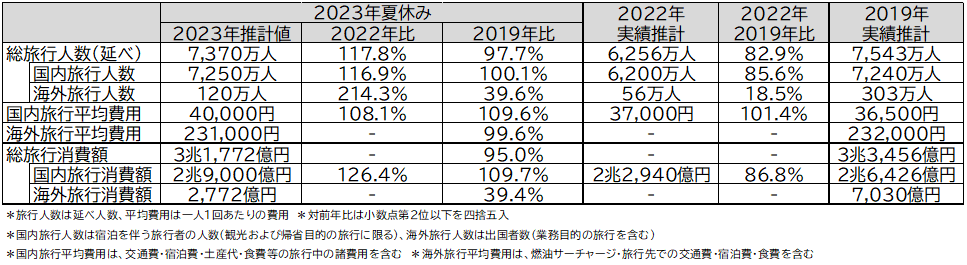
(図表1)夏休み旅行動向推計数値
【旅行動向アンケート 調査方法】
調査実施期間: 2023年6月14日~17日
調査対象: 全国15歳以上79歳までの男女個人
サンプル数: 事前調査20,000名 本調査2,060名
(本調査対象者は、事前調査で「夏休みに旅行に行く/たぶん行く」と回答した人から抽出)
調査内容: 2023年7月15日~8月31日に実施する1泊以上の旅行
(国内旅行は観光および帰省目的の旅行に限る、海外旅行は業務目的の旅行を含む)
調査方法: インターネットアンケート調査 (調査委託先:株式会社マクロミル)
<社会経済環境と生活者の動き>
1.新型コロナウイルス感染症と旅行・観光の動き
新型コロナについて、WHO(世界保健機関)は2023年5月5日に「国際的に懸念される公衆衛生上の緊急事態」の宣言を終了すると発表しました。各国・地域では、終了発表以前から社会経済活動の正常化に向けた取り組みを行っており、この発表を受けてその動きは一層加速化しています。現時点においても、入国制限措置や行動制限措置を課している国や地域はあるものの、水際対策の緩和は着実に進んでおり、国際航空便や国際クルーズ船は新型コロナ前を視野に入れた運航体制が整備されつつあります。
国内旅行については、2023年4月以降も「全国旅行支援」が継続され、また5月8日には新型コロナの感染症法上の位置づけが季節性インフルエンザと同等の「5類」に移行したことを受け、順調に推移しています。2023年5月の日本人延べ宿泊者数は41,147千人で、10連休だった2019年同月(41,675千人)を下回ったものの、2018年同月(36,636千人)を上回っています。各地では訪日外国人観光客の回復もあり、賑わいが戻ってきている一方で、一部の観光地・観光エリアでは新型コロナによる環境変化でサービス業に従事する人手不足などの事象があり、オーバーツーリズムの問題が懸念されています。
*1:観光庁「宿泊旅行統計調査」より、2023年5月の数値は第1次速報値、2019年5月及び2018年5月の数値は確定値
海外旅行については、日本の水際対策が4月29日に終了し、出入国対応がコロナ前の状態に戻ったため、制度上は海外旅行に行きやすくなりました。但し、海外旅行者数の回復は遅れており、2023年5月の日本人出国者数は676千人で、10連休だった2019年同月(1,438千人)と比べ47.0%、2018年同月(1,384千人)と比べ48.8%にとどまっています。
*2:日本政府観光局(JNTO)「訪日外客数・出国日本人数」より、2023年5月の数値は推計値、2019年5月及び2018年5月の数値は確定値
2.旅行やレジャー消費をとりまく経済環境と生活者意識
日本経済は、新型コロナによる制約が概ね取り除かれたことで回復途上にあるものの、地政学的要因や欧米の金融政策などの影響を受け、引き続き景気の先行きが見通しにくい状況が続いています。2023年6月の月例経済報告の基調判断では、10カ月ぶりに上方修正された5月に続き「緩やかに回復」となっています。個人消費についても、5月以降は「持ち直している」となっています。他方、海外景気の下振れが景気を下押しするリスクとされており、物価上昇、金融資本市場の変動等への注意を促しています。
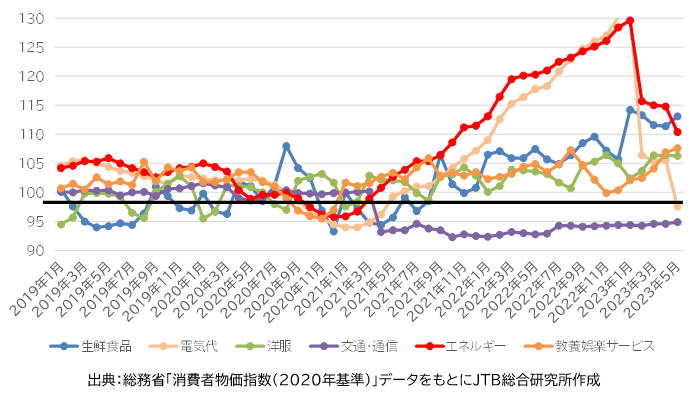
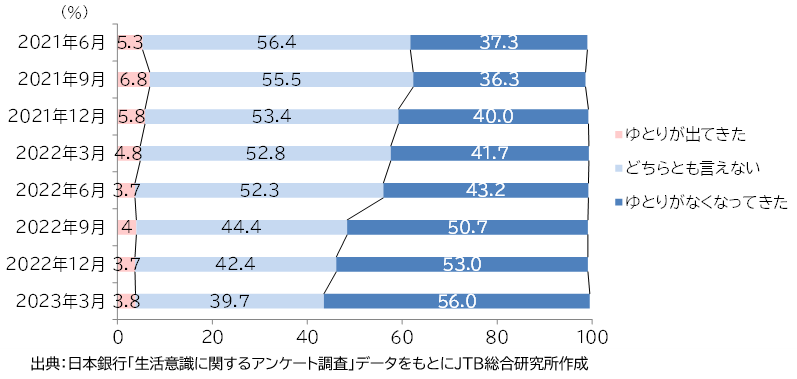
日経平均株価は現状で3万円を上回る傾向が続いていますが、足元では引き続き厳しい経済状況が続いています。為替相場については、2022年以降円安ドル高が急速に進み、現在は140円台で推移しています。この影響により、2022年後半から輸入品やエネルギーなどの価格の高騰が続き、物価上昇が家計に影響を与えています。主な項目の消費者物価指数を見ると、補助金が投入されている電気代を除いて引き続き高い傾向がみられ、交通・通信費も上昇しています (図表2)。このような状況を受け、暮らし向きは厳しさが増しています。日本銀行が実施している「生活意識に関するアンケート調査」の「現在の暮らし向き」をみると、「ゆとりがなくなってきた」の割合は2021年9月以降増加傾向にあり、2023年3月には56.0%と2022年12月時点から3.0ポイント高くなっています(図表3)。
(図表2)消費者物価指数の推移
(図表3)現在の暮らし向き
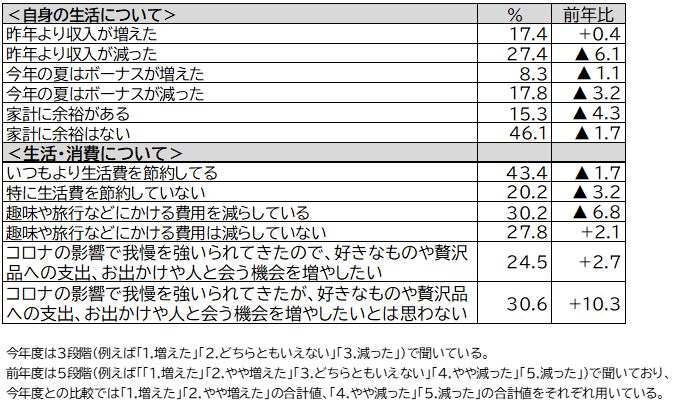
当社が実施したアンケート調査において、収入・家計について当てはまる状況を聞いたところ、「昨年より収入が増えた(17.4%)」は前年調査より0.4ポイント増加、「昨年より収入が減った(27.4%)」は同6.1ポイント減少となり、収入面では良化傾向がみられます。また、「今年の夏はボーナスが増えた(8.3%)」は同1.1ポイント減少となりましたが、「今年の夏はボーナスが減った(17.8%)」の同3.2ポイント減よりも減少幅は小さくなっており、ボーナスも僅かながら良化しています。これらの影響もあってか、生活・消費については「趣味や旅行などにかける費用は減らしていない(27.8%)」が前年調査より同2.1ポイント増加、「趣味や旅行などにかける費用を減らしている(30.2%)」は同6.8ポイント減少となり、消費に明るい兆しがみられます。その一方で、家計についてはまだ厳しい状況が続いており、生活費の切り詰めや贅沢品への支出などは抑えられる傾向がみられます(図表4)。
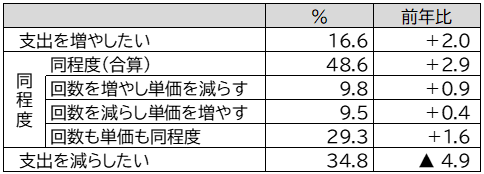
今後1年間の旅行の支出に対する意向をみると、前述の「趣味や旅行などにかける費用」と同様の傾向がみられ、「旅行支出を増やしたい(16.6%)」は2.0ポイントの増加、「旅行支出を減らしたい(34.8%)」は4.9ポイントの減少となり、前年よりも支出を増やす意向が強い結果となりました(図表5)。
(図表4)今年の自身の生活について(複数回答、N=20,000)
(図表5)今後1年間の旅行の支出に対する意向(単一回答、N=20,000)
<夏休みの旅行動向予測>
3.夏休みの旅行意向(アンケート結果より)
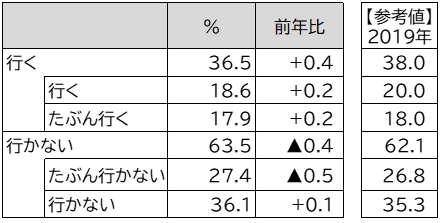
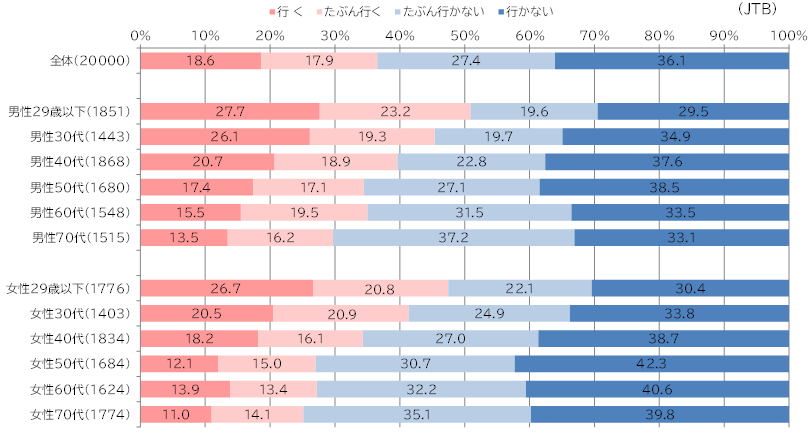
今年の夏休みの旅行意向については、前述のアンケートによると、「行く("行く"と"たぶん行く"の合計)」と回答した人は調査時点で36.5%と前年から0.4ポイント増加しました(図表6)。2019年に実施した同調査では38.0%でしたので、意向は前年からさらにコロナ禍前に近づいているといえます。性年代別でみると、男女とも若い年代ほど旅行意向が高い傾向がみられました。「行く("行く"と"たぶん行く"の合計)」は、男性29歳以下は50.9%(前年比▲2.8p)、女性29歳以下は47.5%(同▲3.1p)と減少しました。一方、男性60代は35.0%(同+2.3p)、女性60代は 27.3%(同+3.7p)、男性70代は29.7%(同+2.0p)、女性70代は25.1%(同+2.8p)となり、男女29歳以下の旅行意向が減少する一方で、シニア層の意向が前年に比べて高くなっており、コロナ禍では慎重だったこれらの層が前向きになっている様子が伺えます(図表7)。
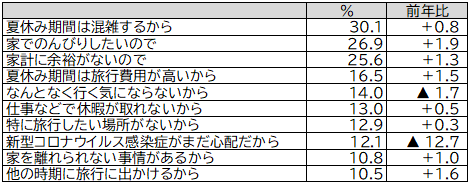
旅行に行かない人に理由を聞いたところ、最も多かったのが「夏休み期間は混雑するから(30.1%)」、次いで「家でのんびりしたいので(26.9%)」となりました。また「新型コロナウイルス感染症がまだ心配だから(12.1%)」は、前年から12.7ポイント減と大きく減少しました(図表8)。
(図表6、7)夏休み(2023年7月15日~8月31日)の旅行意向 (単一回答・性年代別、N=20,000)
(図表8)今回の夏休み旅行に行かない理由 (複数回答、N=12,697)
4.今年の夏休みの旅行者の予測
総旅行人数は7,370万人(対前年117.8%、対2019年97.7%)
国内旅行の人数は2019年水準まで回復、旅行費用は物価や需要高により上昇
海外旅行の人数は2019年比4割程度と、回復基調
夏休み期間(2023年7月15日~8月31日)の旅行動向については、各種経済指標、業界動向や交通機関各社の動き、宿泊施設の予約状況、各種意識調査などをもとに算出し、総旅行人数(延べ)は7,370万人(対前年117.8%、対2019年97.7%)、総旅行消費額は3兆1,772億円(対2019年95.0%)と推計します。
このうち、国内旅行人数は7,250万人(対前年116.9%、対2019年100.1%)、国内旅行平均費用は40,000円(対前年108.1%、対2019年109.6%)、国内旅行消費額は2兆9,000億円(対前年126.4%、対2019年109.7%)と見込まれます。 前述のアンケートにおける「行く("行く"と"たぶん行く"の合計)」の割合は2019年をやや下回るものの、国内旅行の意向については海外旅行ほど低下していないため、国内旅行者数はほぼ2019年並みと予想されます。なお、平均費用は物価の高騰や旅行需要の拡大、サービス業の人手不足の影響など旅行関連費用の高騰から、本調査を開始して以来過去最高となりました。
海外旅行人数については、120万人(対前年214.3%、対2019年39.6%)、3年ぶりの推計となった海外旅行平均費用は231,000円(対2019年99.6%)、海外旅行消費額は2,772億円(対2019年39.4%)と推計します。意欲の高まりは見られるものの、物価高や円安、久しぶりの海外に対する不安などから短期で比較的日本から近い行先が人気となっており、ゆるやかではあるものの回復基調となっています。
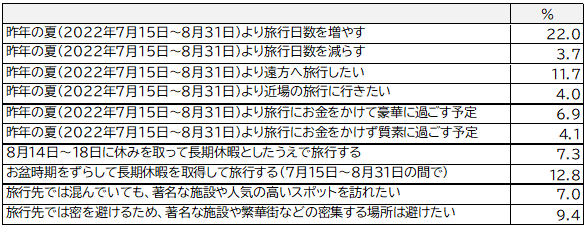
今年の夏休みの旅行に対する考え方を聞いたところ、「昨年の夏より旅行日数を増やす」が22.0%で最も多く、「昨年の夏より旅行日数を減らす(3.7%)」を大きく上回りました。またお盆を含む「8月14日~18日に休みを取って長期休暇としたうえで旅行する」が7.3%であったのに対し、「お盆時期をずらして長期休暇を取得して旅行する」が12.8%となりました。混雑や旅費の高騰などを避けて旅行する動きも相応にみられます(図表9)。
(図表9)今年の夏休みの旅行に対する考え方について(複数回答、N=2,060)(選択項目は一部を抜粋)
具体的な傾向については、次章以降で述べる通りです。
5.今年の夏休みの国内旅行は、長期化、遠距離化が加速、同行者の対象や人数が拡大
旅行目的は風景・食事・名所などを楽しむ、コロナ禍前の観光に戻る傾向
今年の夏休みの旅行に関するアンケート調査において、本調査回答者(2,060名)のうち、旅行先を「日本国内」と答えた1,816名の旅行の傾向を分析しました。緊急事態宣言が発出した一昨年の夏休みに比べ、制限のなかった昨年は長期化、遠距離化がみられ、また同行者は近しい家族から友人・知人に拡大しました。今年はさらにその傾向が強まり、コロナ禍前に戻りつつあることが実感できます。また利用公共交通機関については航空機、JR新幹線が増加しています。具体的な調査結果は以下のとおりです。
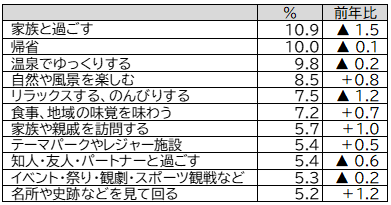
旅行目的:「家族と過ごす(10.9%)」が最も多くなりました。次いで「帰省(10.0%)」「温泉でゆっくりする(9.8%)」となりました。また、「自然や風景を楽しむ(8.5%)」「食事、地域の味覚を味わう(7.2%)」「名所や史跡などを見て回る(5.2%)」などが増加しました。感染症予防のため家族や親しい人と特定の場所で過ごす傾向が高まっていたコロナ禍に比べ、風景や名所、名物などを楽しむ需要が戻りつつあると考えられます(図表10)。
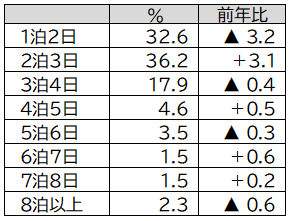
旅行日数:全体では、「2泊(36.2%)」が前年から3.1ポイント増加し、最も多くなりました。次いで、「1泊(32.6%)」が前年から3.2ポイント減少、「3泊(17.9%)」が0.4ポイント減少となりました(図表11)。
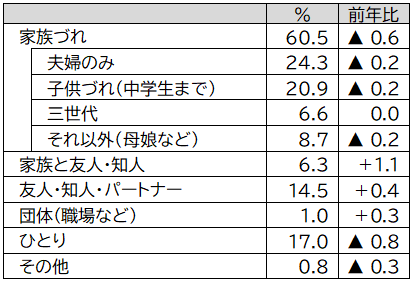
同行者:「夫婦のみ(24.3%)」が最も多く、次いで「子供づれ(中学生までの子供がいる)の家族旅行(20.9%)」となり、「家族づれ」全体は60.5%となりました。コロナ禍では増加傾向にあった「ひとり(17.0%)」は減少しました。一方、「家族と友人・知人(6.3%)」「友人・知人・パートナー(14.5%)」「団体(1.0%)」はいずれも増加しました。コロナ禍で増えていた、家族やひとりが中心だった旅行から、同行者の対象が拡大する傾向が昨年に続き見られます(図表12)。
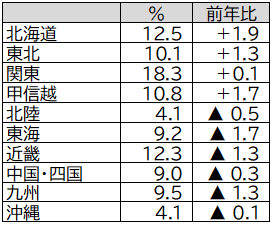
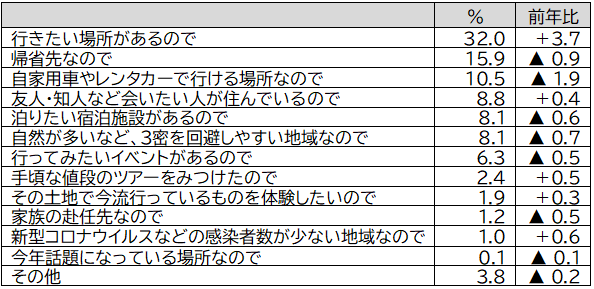
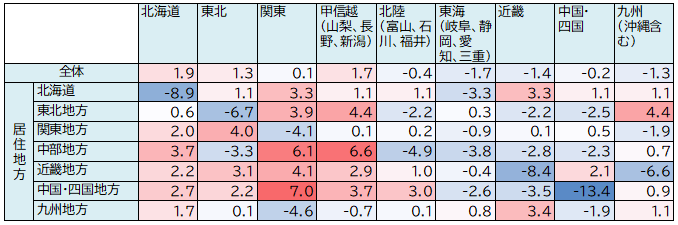
旅行先:「関東(18.3%)」が最も多く、次いで「北海道(12.5%)」「近畿(12.3%)」「甲信越(10.8%)」「東北(10.1%)」となりました(図表13)。その旅先を選んだ理由として、「行きたい場所があるので(32.0%)」が最も多く、次いで「帰省先なので(15.9%)」「自家用車やレンタカーで行ける場所なので(10.5%)」「友人・知人など会いたい人が住んでいるので(8.8%)」となりました(図表14)。海外旅行の旅行先については6章で詳しく述べます。
居住地別に旅行先を見ると、旅行先と居住地が同じ地方である域内旅行の割合は、九州地方以外のすべての地域で前年より減少となり、域外の旅行が増加しています(図表15、16)。
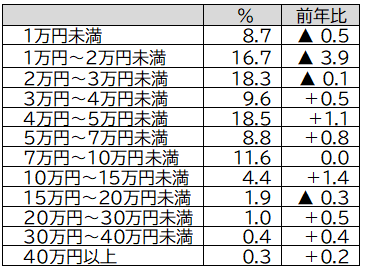
一人当たりの旅行費用:全体では、「4万円~5万円未満(18.5%)」が前年から1.1ポイント増加し最も多く、次いで「2万円~3万円未満(18.3%)」、「1万円~2万円未満(16.7%)」となりました。4万円以上の合計は前年に比べて4.1ポイントの増加となり、全体的に費用は増加傾向といえます(図表17)。
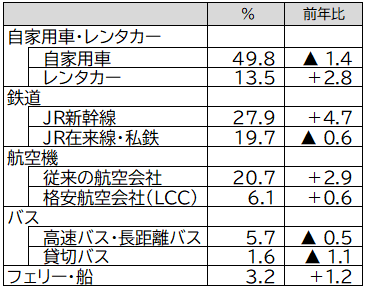
利用交通機関:「自家用車(49.8%)」が最も多かったものの、前年より1.4ポイント減少しました。次いで「JR新幹線(27.9%)」「従来の航空会社(20.7%)」で、いずれも増加しました。コロナ禍では感染対策として他人との接触を避けるため、自家用車の利用による近距離旅行の傾向が顕著でしたが、新幹線や航空機を使って遠方へ行く意向が高まっています(図表18)。
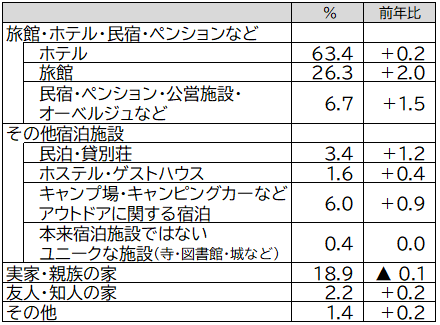
利用宿泊施設:「ホテル(63.4%)」が最も多く、次に「旅館(26.3%)」、「実家や親族の家(18.9%)」となりました。前年から増加率が高かったものは上位から「旅館 (26.3%、同+2.0p)」「民宿・ペンション・公営施設・オーベルジュなど(6.7%、同+1.5p)」「民泊・貸別荘(3.4%、同+1.2p)」となりました。一方「実家・親族の家(18.9%)」は0.1ポイントの減少となりました(図表19)。
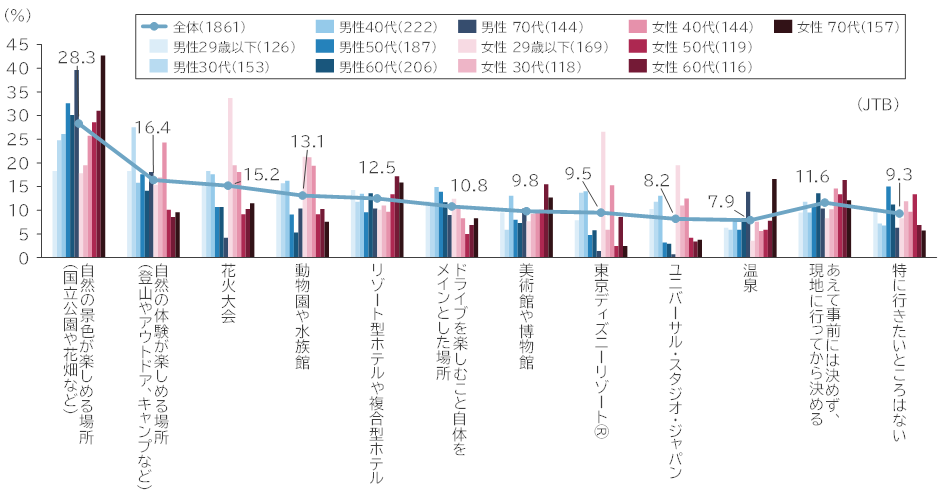
出かける場所として気になっているところは「自然の景色が楽しめる場所(国立公園や花畑など)(28.3%)」、次いで「自然の体験が楽しめる場所(登山やアウトドア、キャンプなど)(16.4%)」となりましたが、いずれも前年より減少しています。性年代別に見ると、「自然の景色が楽しめる場所(国立公園や花畑など)」は男女70代が高く、「自然の体験が楽しめる場所(登山やアウトドア、キャンプなど)」は男性30代、女性40代が高い結果となりました。また「花火大会」「東京ディズニーリゾート®」「ユニバーサル・スタジオ・ジャパン」はいずれも女性29歳以下が最も高くなっています(図表20)。
JTBの宿泊・国内企画商品の予約状況をみると、旅行意欲の回復から前年比は120%(7月5日付)となりました。人気方面では、1位沖縄、2位関西、3位北海道となっています。またユニバーサル・スタジオ・ジャパン、東京ディズニーリゾート®などのテーマパークやジブリパークへの需要も高まっています。
(図表10)旅行目的(単一回答、N=1,861)(選択項目は一部を抜粋)
(図表11)旅行日数(単一回答、N=1,861)
(図表12)旅行の同行者(単一回答、N=1,861)
(図表13)旅行先(単一回答、N=1,861)
(図表 14)旅行先を選んだ理由(単一回答、N=1,861)
(図表15)居住地別 夏休みの旅行先(地方別、単一回答、N=1,861)
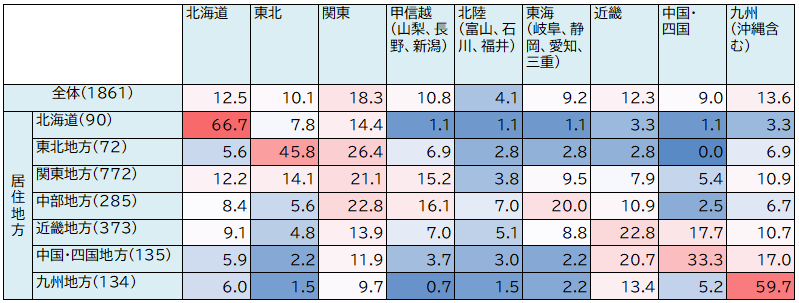
(図表16)居住地別 夏休みの旅行先の前年増減比(地方別、単一回答、N=1,861)
(図表17)一人当たりの旅行費用(単一回答、N=1,861)
(図表18)利用交通機関(複数回答、N=1,861)
(図表19)利用宿泊施設(複数回答、N=1,861)
(図表20)今年の夏休みに出かける場所として気になっているところ(性年代別)(複数回答、N=1,861)
6.海外旅行の条件は整いつつあり、厳しい環境のなかでもゆるやかな回復傾向
2019年と比べると、旅行日数は短期、ハワイ・韓国・台湾方面が人気
2023年4月29日に日本の水際対策が終了して以来、日本人の海外旅行人数は緩やかに回復しています。昨年は高騰していた燃油サーチャージですが、国内主要航空会社は8月発券分から下げることを発表しており、海外旅行に好影響を与えることが期待されます。コロナ禍において失効したパスポートの申請も順調で、都心部においては手続きに長蛇の列ができるなど旅行に対する前向きな意識がうかがえます。
一方で、航空路線の座席供給数はまだ完全に2019年水準までには回復しておらず、加えて円安や物価高、サービス業の人手不足も世界中で課題となっています。このような状況から、夏休み期間の海外旅行人数は、120万人程度と推計します。対前年214.3%、対2019年では39.6%になります。
本調査対象者の2,060名のうち、今年の夏休みの旅行先を「海外」と答えた人は199名(9.7%)おり、前年より5.0ポイント上昇しています。参考値になりますが、2019年は10.5%でした。
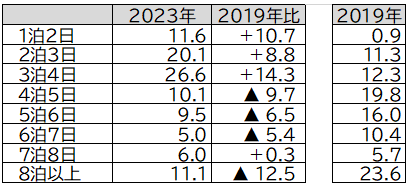
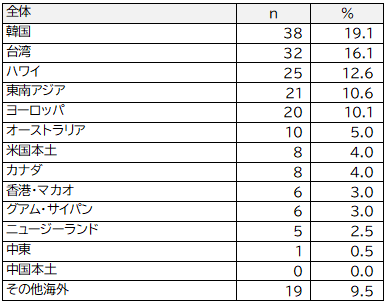
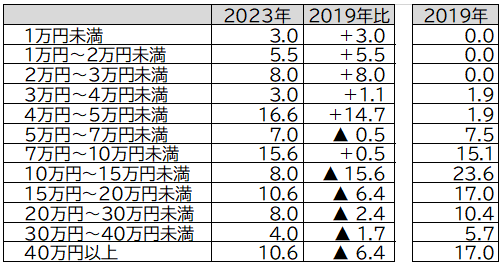
旅行日数は「3泊(26.6%)」が最も多く、次いで「2泊(20.1%)」、「1泊(11.6%)」となりました。3泊以下の合計は2019年と比べると33.8ポイント増加しています。行先は上位から、「韓国(19.1%)」「台湾(16.1%)」「ハワイ(12.6%)」となりました。また旅行費用は「4万円~5万円未満(16.6%)」が最も多く、次いで「7万円~10万円未満(15.6%)」となりました。5万円未満の合計は2019年と比較すると32.3ポイント増加しています。今年の夏休みの海外旅行は短期で比較的日本に近い旅行先が人気で、それに伴い旅行費用も僅かながら抑えられている様子がうかがえます(図表21~23)。
JTBの海外企画商品の人気方面では、1位ハワイ、2位韓国、3位台湾となっています。グアム、シンガポールの人気も高く、アジアを中心とした近場の旅行先への需要が高くなっています。
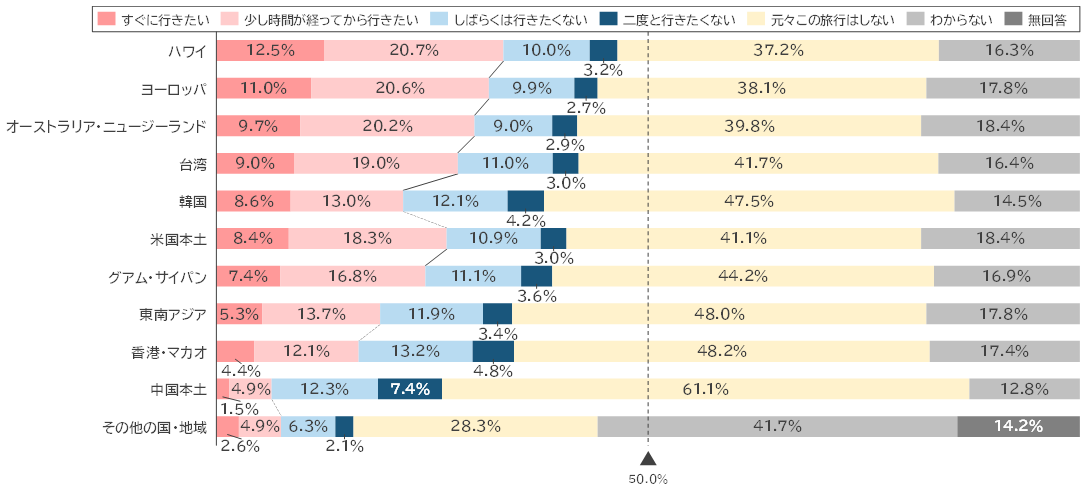
また、この夏休みに旅行に行かない人も含めた事前調査対象者に、夏休み以降も含めた今後の海外旅行に対しての意向を聞きました。海外旅行の行先別の実施時期をみると、「すぐに行きたい」という回答は「ハワイ(12.5%)」が最も多く、次いで「ヨーロッパ(11.0%)」「オーストラリア・ニュージーランド(9.7%)」となりました。東アジアについては、上位から「台湾(9.0%)」「韓国(8.6%)」となりました。今年の夏休みは短期で行ける近場から回復するものの、遠方への旅行意欲も一定数あり、今後回復していくことが期待されます(図表24)。
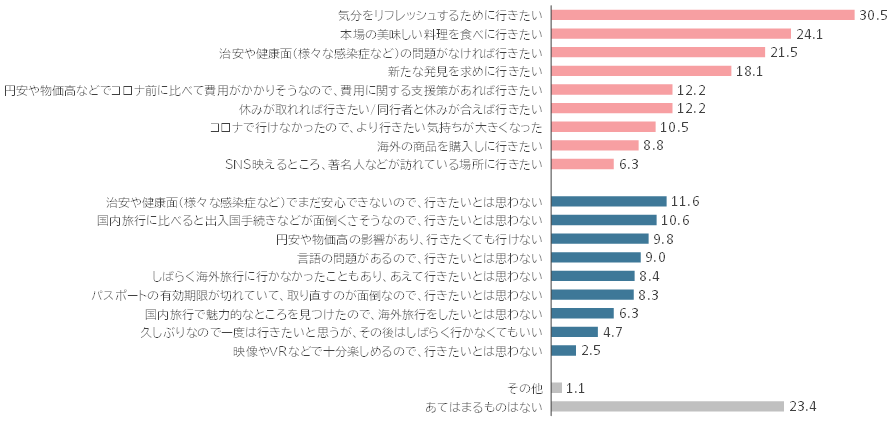
加えて、現在の海外旅行に対する意向を聞いたところ、肯定的な意見としては、上位から「気分をリフレッシュするために行きたい(30.5%)」「本場の美味しい料理を食べに行きたい(24.1%)」「治安や健康面(様々な感染症など)の問題がなければ行きたい(21.5%)」となりました。一方で、「治安や健康面(感染症など)でまだ安心できないので、行きたいとは思わない(11.6%)」「国内旅行に比べると出入国手続きなどが面倒くさそうなので、行きたいとは思わない(10.6%)」「円安や物価高の影響があり、行きたくても行けない(9.8%)」などの意見もあり、安全且つ経済的負担の少ない環境の形成が望まれます(図表25)。
(図表21)旅行日数(海外のみ)(単一回答、N=199)
(図表22)今年の夏休みの旅行先(海外のみ)(単一回答、N=199)
(図表23)一人当たりの旅行費用(海外のみ)(単一回答、N=199)
(図表24)行先別、今後の海外旅行の実施について(単一回答、N=20,000)
(図表25)現在の海外旅行に対する意向 (複数回答、N=20,000)
(図表26)「夏休みの旅行動向」推計数値の推移
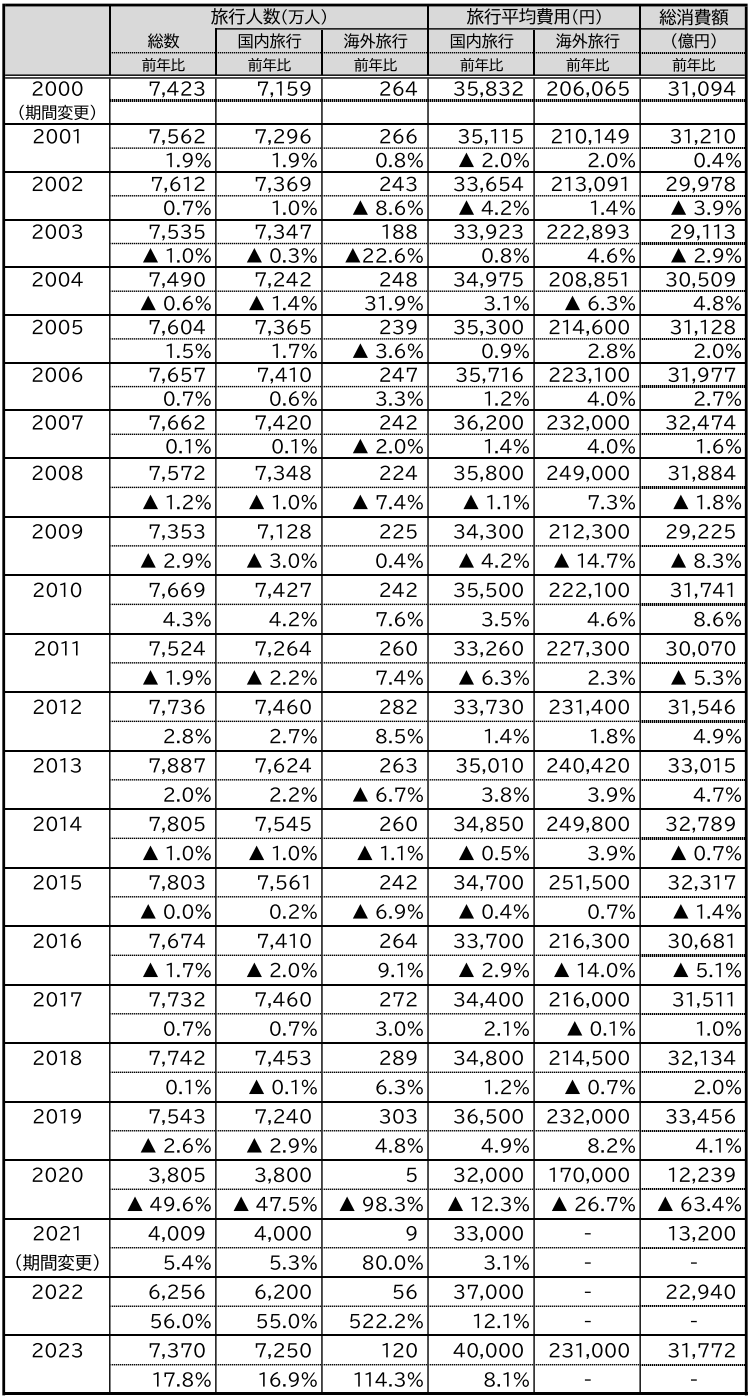 *対象期間は7月15日~8月31日 (ただし2021年のみ、7月20日~8月31日)。
*調査開始は1969年。海外旅行人数は実績値。
*平均費用については、1993年より推計。2003年以前は動向結果により前年の発表数値から一部修正。
*国内旅行人数は推計値で、2003年以前は動向結果により前年の発表数値から一部修正。
*2019年より市場調査をインターネットアンケート調査に変更。
*2021年・2022年は海外旅行平均費用および海外旅行消費額を算出していないため、総旅行消費額は国内旅行消費額で掲載。
*2021~2023年の総消費額は単純比較が行えないため、前年比の記載なし。
JTB広報室 03-5796-5833(東京) 06-6260-5108(大阪)