2023年ゴールデンウィーク(4月25日~5月5日)の旅行動向
株式会社JTB
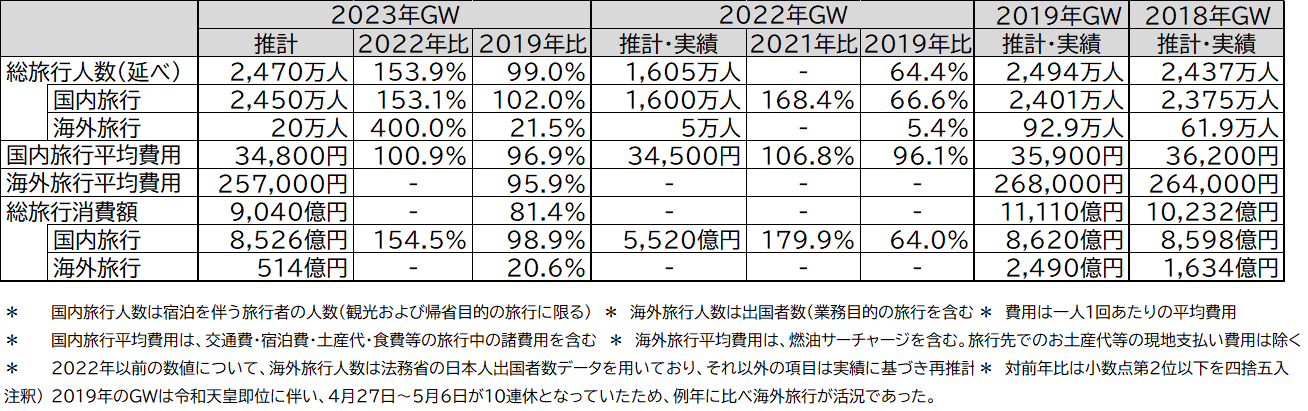
●国内旅行者数は2,450万人(対前年153.1%)
●海外旅行者数は20万人(対前年400.0%)※3年ぶりの算出
●国内は中・近距離志向、海外の人気の行き先は「ハワイ」「韓国」
JTBは、「ゴールデンウィーク(以下、GW)<2023年4月25日~5月5日>の1泊以上の旅行に出かける人」の旅行動向見通しをまとめました。市場推計については、新型コロナウイルス感染症(COVID-19/以下新型コロナ)の影響により国内旅行者数のみ公表していましたが、現在、感染状況が落ち着いていること、国が海外渡航の制限の緩和を進めていることから、海外旅行についても3年ぶりに算出しました。
本レポートは、1泊以上の日本人の旅行について、各種経済動向や消費者行動調査、運輸・観光関連データ、JTBグループが実施したアンケート調査などから推計したもので、1969年より継続的に調査を実施しています。
(図表1)2023年GW旅行動向推計数値
【旅行動向アンケート 調査方法】
調査実施期間: 2023年3月13日~20日
調査対象: 全国15歳以上79歳までの男女個人
サンプル数: 事前調査20,000名 本調査2,060名
(事前調査で「GWに旅行に行く/たぶん行く」と回答した人を抽出し本調査を実施)
調査内容: 2023年4月25日~5月5日に実施する1泊以上の旅行
(国内旅行は観光および帰省目的の旅行に限る、海外旅行は業務目的の旅行を含む)
調査方法: インターネットアンケート調査
<社会経済環境と生活者の動き>
1.新型コロナウイルス感染症と旅行・観光の動き
新型コロナは、WHO(世界保健機関)による終息宣言が発出されていませんが、影響は世界全体で小さくなりつつあります。各国や地域では社会経済活動の正常化に向けて舵を切っており、出入国における水際対策の緩和が進み、国際航空便や国際クルーズ船の運航再開の動きが広がっています。UNWTO(国連世界観光機関)によると、2022年の国際観光客到着数はコロナ禍前の6割程度でしたが、2023年は堅調に推移した場合、80~95%にまで回復する可能性があるとしています*1。
*1:UNWTO「World Tourism Barometer January 2023」より
国内については、個人が感染症対策を行いながら旅行することが日常となる中、政府は2022年10月より全国的な観光需要喚起策として「全国旅行支援」を始めました。また、2023年3月13日からマスクの着用が個人の判断となり、5月8日から新型コロナの感染症法上の位置づけを季節性インフルエンザと同等の「5類」に移行する方針も発表しています。現在、多くの国内旅行者が各地で見られるようになり、「全国旅行支援」の割引率の高かった2022年12月の日本人延べ宿泊者数は4,092万人と2019年12月(3,795万人)を7.8ポイント上回りました*2。「全国旅行支援」は2023年4月以降も実施されています(4月29日~5月7日は対象外)。
*2:観光庁「宿泊旅客統計調査」より、2022年12月の数値は第2次速報値、2019年12月の数値は確定値
2022年 10 月 11 日からの水際対策緩和では、 1 日あたりの新規入国者数の上限撤廃、陰性証明や隔離期間など入国時の条件の緩和、訪日外国人観光客の個人旅行の解禁などが行われ、日本人の海外旅行と外国人の訪日旅行が容易になりました。2023年2月の訪日外国人数(推計値)は147万5,300人で、2019年2月と比べ57%にまで回復しています*3。一方、2023年2月の出国日本人数(推計値)は53万7,700人で、2019年2月と比べ35%にとどまっています*3。
*3:日本政府観光局(JNTO)「訪日外客数・出国日本人数」より
2.旅行やレジャー消費をとりまく経済環境と生活者意識
日本経済は、新型コロナによる停滞からの回復を目指しているものの、不安定な国際情勢やそれに起因する物価高騰、最近では米銀行破綻やグローバルIT企業などの人員削減といった懸念材料も新たに発生し、景気の先行きが見通しにくい状況が続いています。2023年3月の月例経済報告の基調判断では、景気の持ち直しが期待されているものの、海外景気の下振れ、物価上昇、供給面での制約、金融資本市場の変動等をリスクや注意点として示しています。しかしながら、個人消費については、2022年7月以降、「緩やかに持ち直している」との判断が続いています。
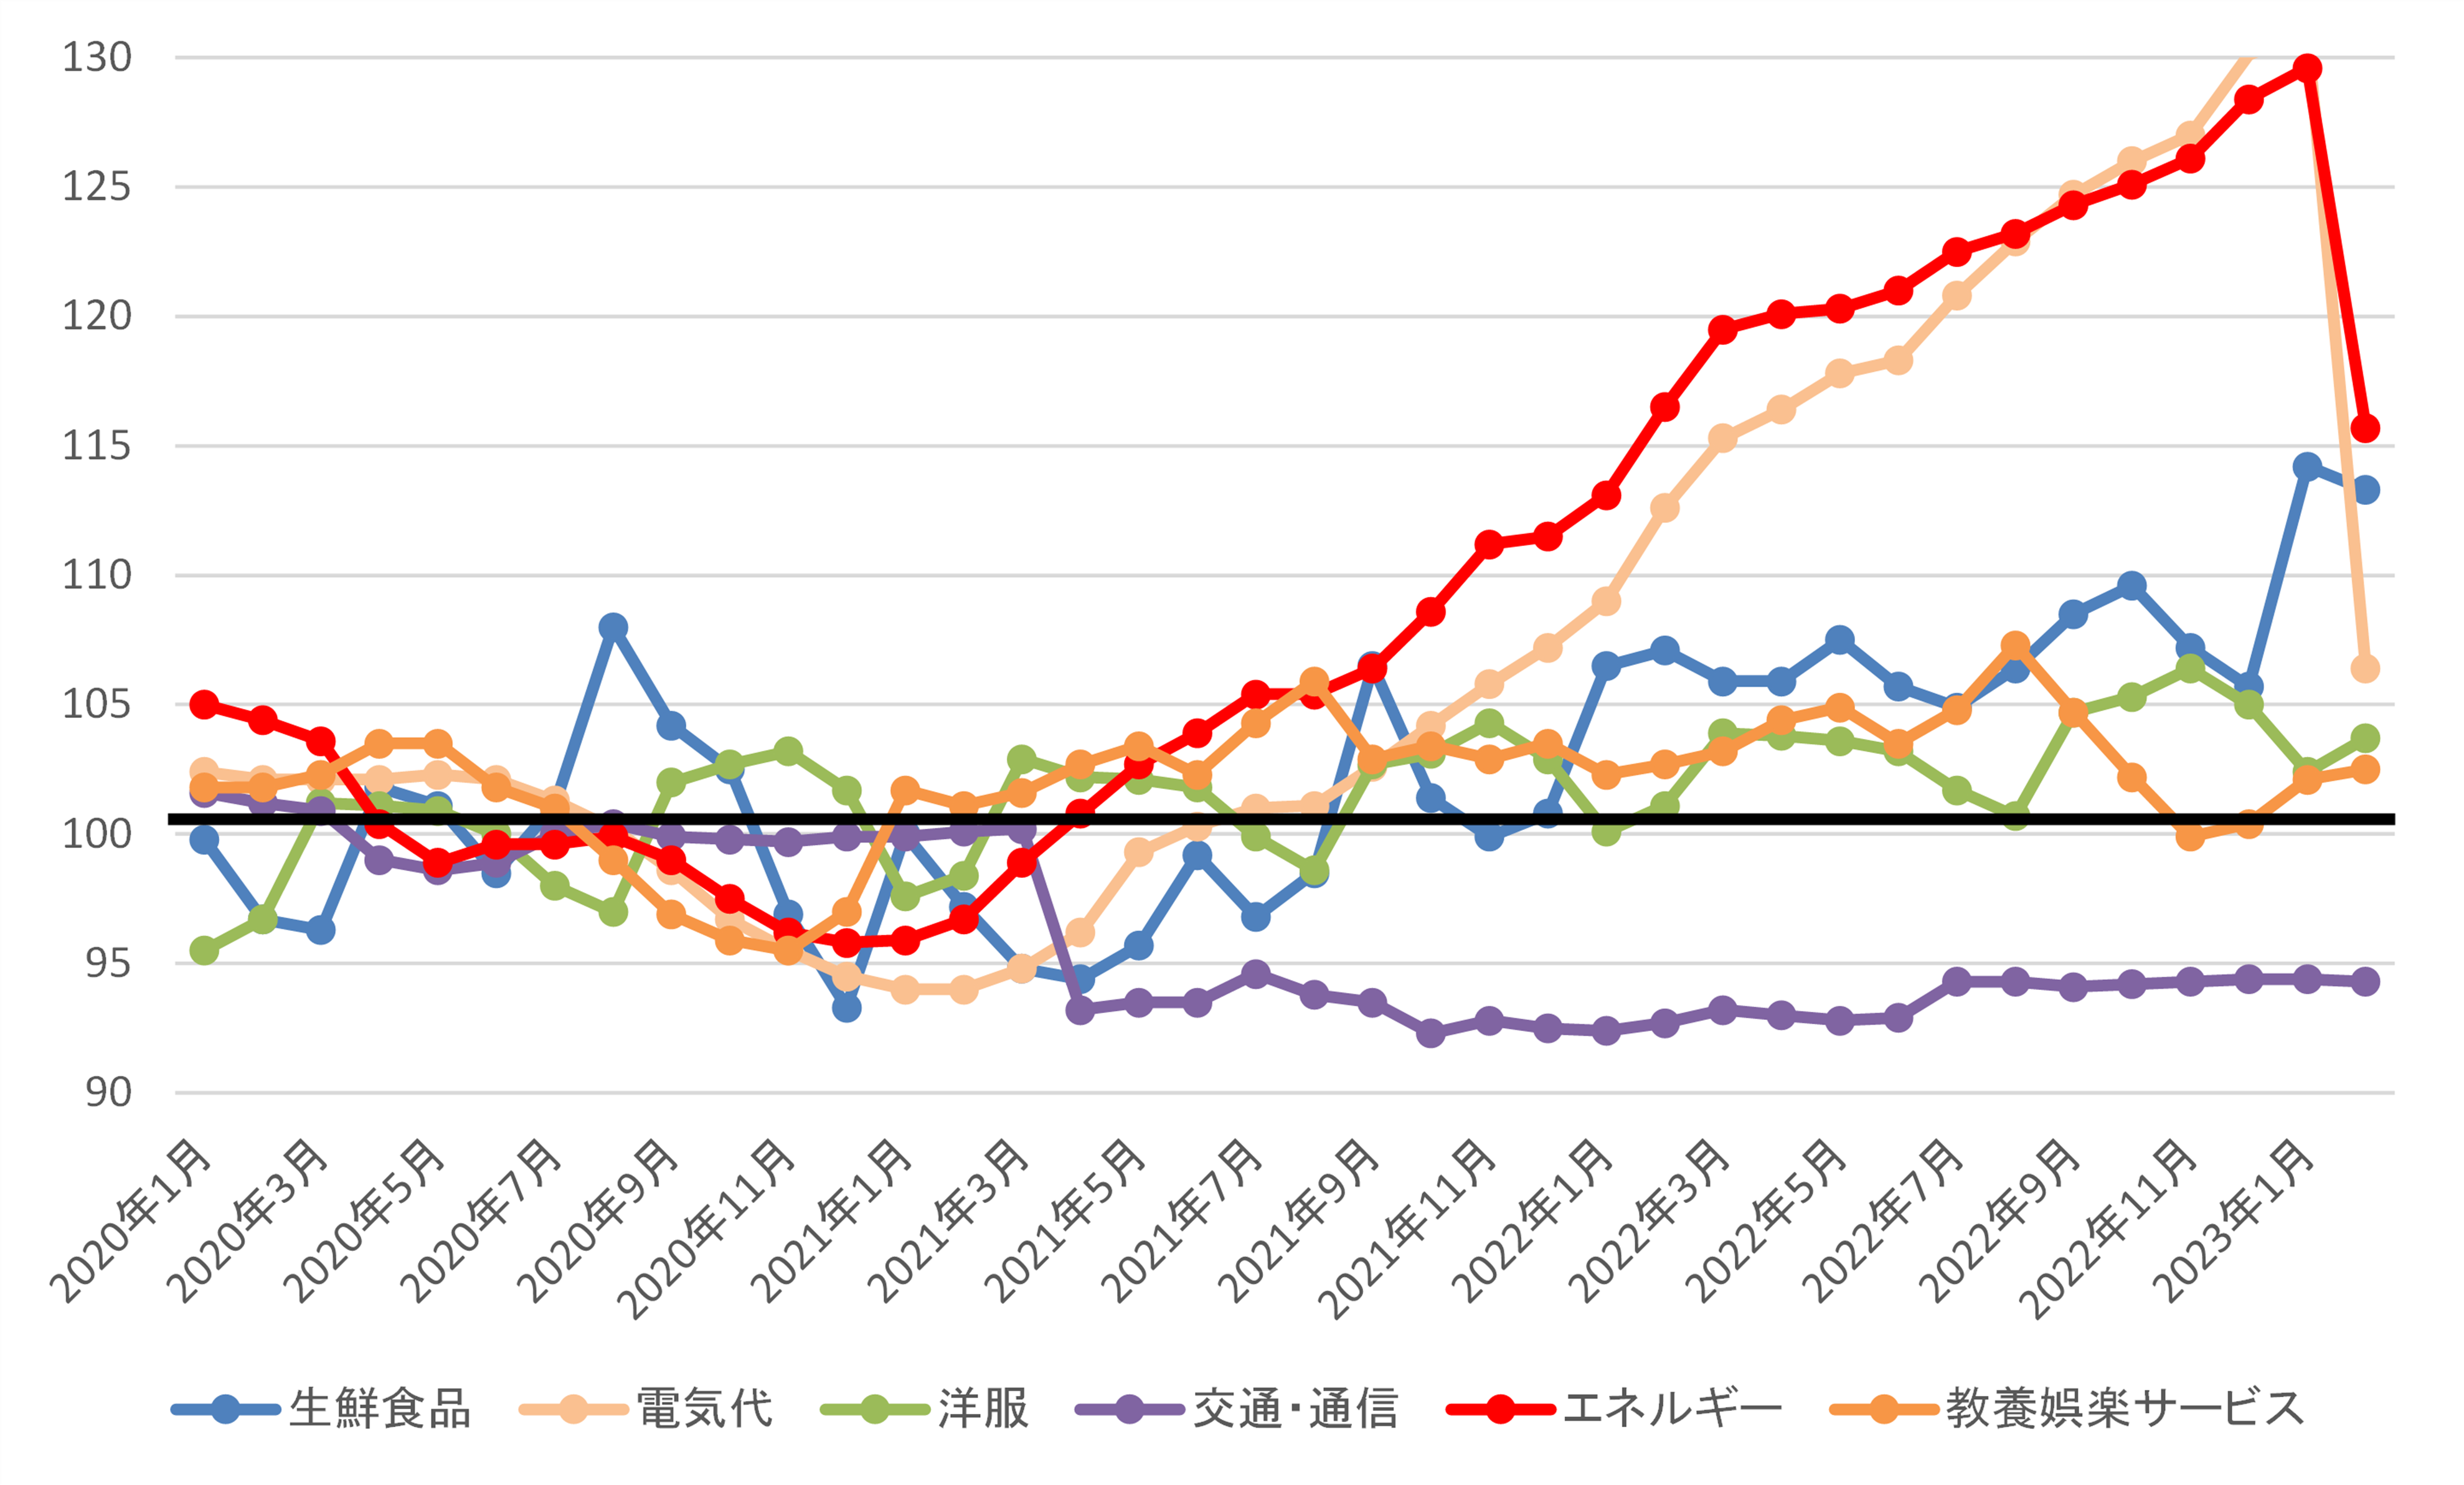
足元の経済状況をみると、為替相場については2022年以降円安ドル高が急速に進み、現在も130円前後で推移しています。この影響により、2022年後半から輸入品やエネルギーなどの価格の高騰が続き、物価上昇が家計に影響を与えています。
主な項目の消費者物価指数を見ると、ここ1年以上は交通・通信以外の項目で上昇もしくは横ばいの傾向が続いています。エネルギーや電気代は2023年2月に上げ幅が抑えられたものの、依然として高い傾向が続いています(図表2)。
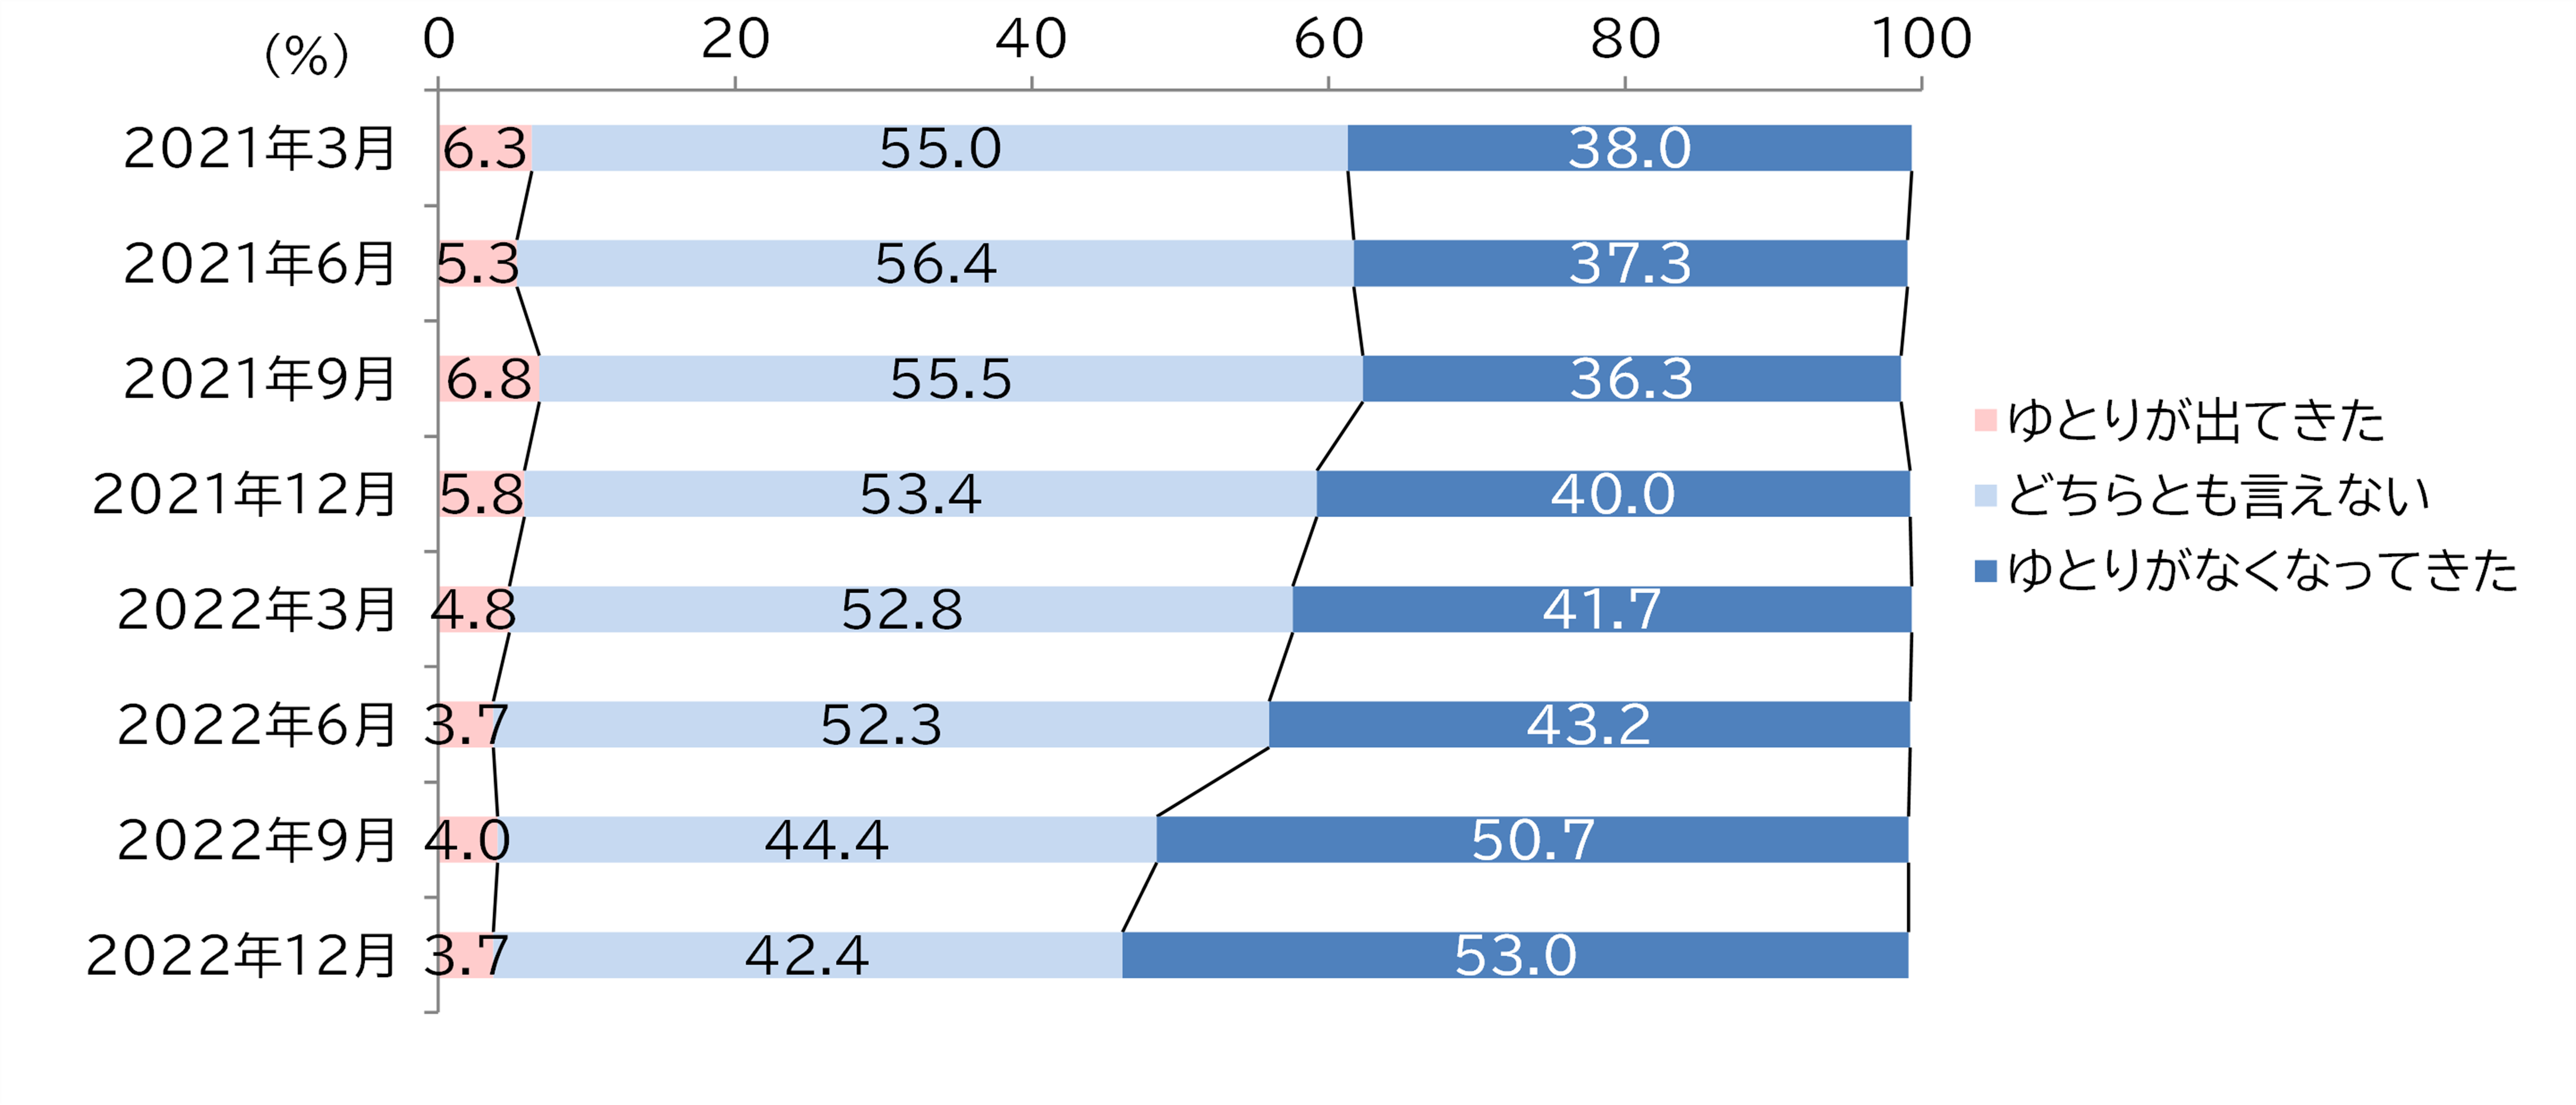
このような状況を受け、暮らし向きは現状では厳しいといえ、日本銀行の「生活意識に関するアンケート調査」の「現在の暮らし向き」では、「ゆとりがなくなってきた」の割合は、2021年9月以降、それまでの横ばいから増加し、2022年12月には53.0%と前年同月から13.0ポイント高くなっています。これはコロナ禍に入ってから最も高い割合です(図表3)。
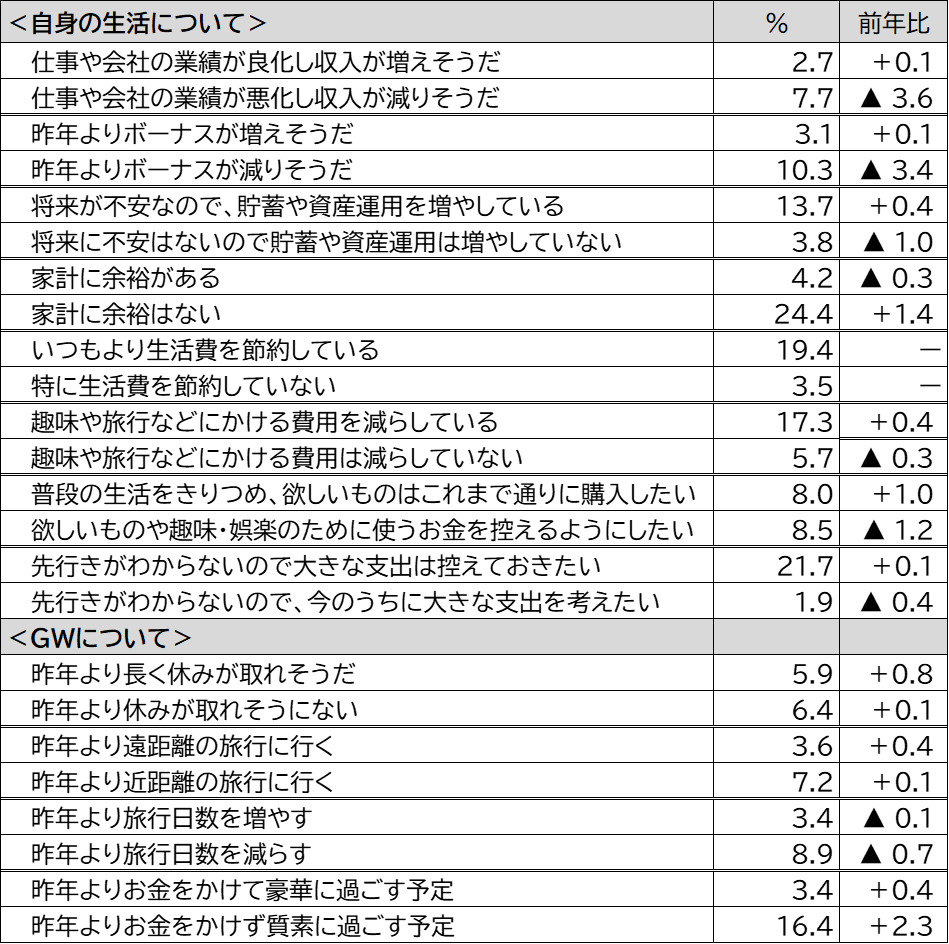
JTBが実施したアンケートで、生活とGWの旅行について当てはまる状況を聞いたところ、「仕事や会社の業績が悪化し収入が減りそうだ(7.7%)」は「収入が増えそうだ(2.7%)」より多いですが、前年より3.6ポイント下がっています。しかしながら「家計に余裕はない(24.4%)」が前年より1.4ポイント増加し、「家計に余裕がある(4.2%)」は0.3ポイント下がりました。また「将来が不安なので、貯蓄や資産運用を増やしている(13.7%)」も前年より0.4ポイント増加し、足元で多少の改善はみられるものの、昨年から家計に余裕のない状況が続いていると考えられます。
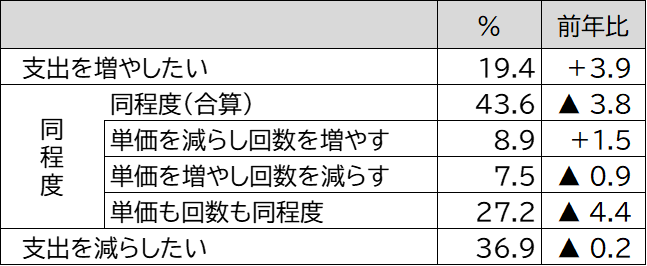
一方で旅行内容については、遠距離よりも近距離、日数増よりも日数減、豪華よりも質素という傾向は依然みられますが、前年と比べるといずれもその差は縮小しており、新型コロナへの警戒心理が幾分か和らいでいるものと捉えられます(図表4)。「今後1年間の旅行支出に対する意向」については、「これまでより旅行支出を減らしたい(36.9%)」が「これまでより旅行支出を増やしたい(19.4%)」を上回りましたが、2022年調査と比較すると、「旅行支出を増やしたい」という割合は3.9ポイント増加しており、旅行に対する前向きな支出を考えている層は増えています(図表5)。
(図表2)消費者物価指数の推移
(図表3)現在の暮らし向き
(図表4) 今の自身の生活とGWについて (複数回答 N=20,000)
(図表5)今後1年間の旅行の支出に対する意向(単一回答 N=20,000)
<ゴールデンウィークの国内旅行動向>
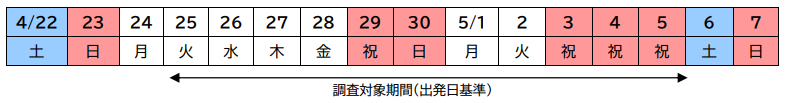
3.ゴールデンウィークのカレンダーと旅行意向
5連休があり、2日休めば9連休も可能、長期休暇になりやすい日並び
「旅行に行く(行く/たぶん行く の合算値)」人は26.5%と2019年並みに回復
今年のGWのカレンダーは、5月3日(水・祝)~7日(日)が5連休です。5月1日(月)と5月2日(火)を休みにすると、4月29日(土・祝)から9連休となります。2023年GW(4月25日~5月5日)の帰省を含めた旅行意向の詳細について、前述のアンケートで聞きました。
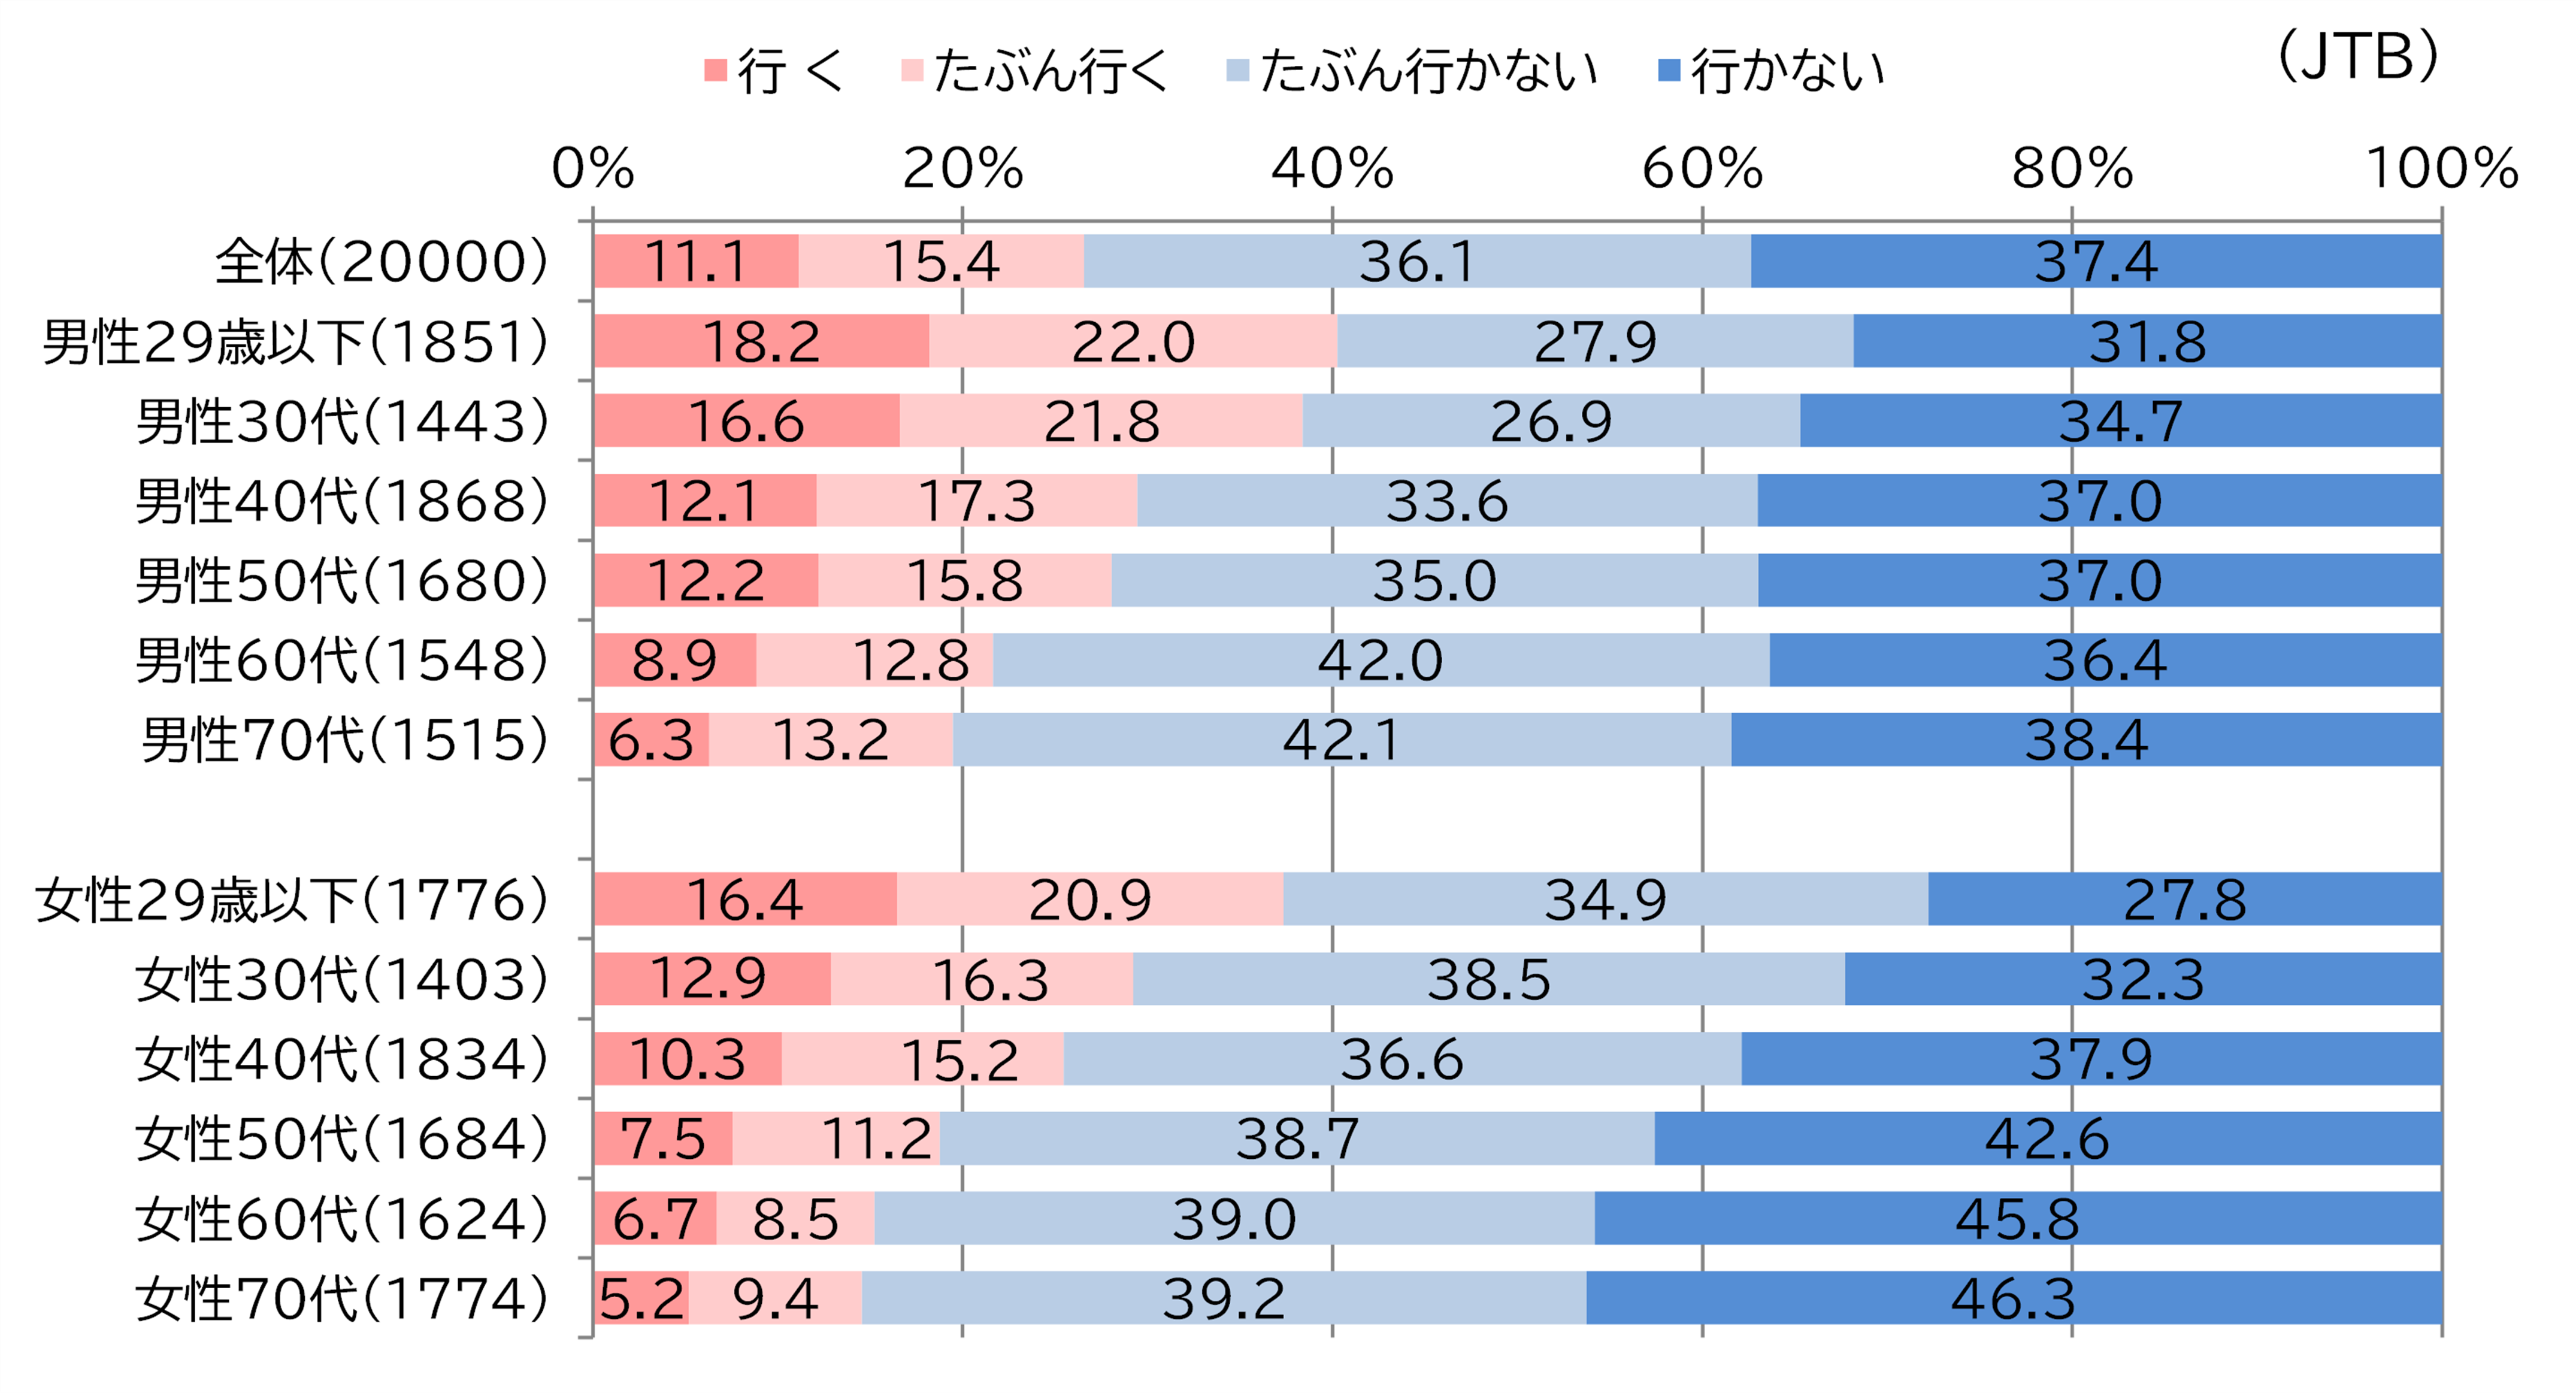
GW期間中に旅行に行くかどうかについては、「行く("行く"と"たぶん行く"の合計)」と回答した人は調査時点で26.5%と前年から9.3ポイント増加しました。コロナ禍前である2019年は26.3%で、旅行意欲はコロナ禍前と同等まで回復しているといえます(図表6)。性年代別でみると、男女とも若い年代ほど旅行意向が高くなる傾向がみられます。「行く("行く"と"たぶん行く"の合計)」との回答は、男性29歳以下が40.2%(前年29.0%)、女性29歳以下が37.3%(同23.7%)であるのに対し、男性70代は19.5%(同11.0%)、女性70代は14.6%(同8.2%)となっています。なお、いずれの世代も大きく回復しています(図表7)。
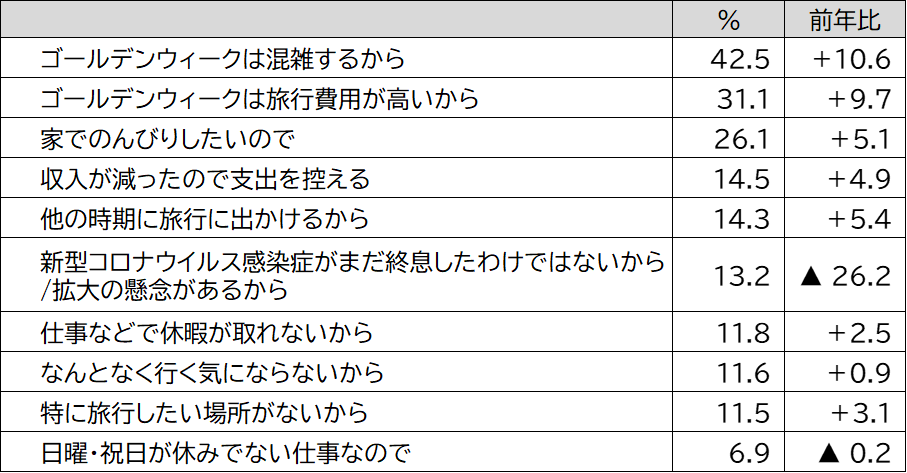
旅行に行かない理由としては、「ゴールデンウィークは混雑するから(42.5%)」が最も多く、前年から10.6ポイント増加しました。次いで、「ゴールデンウィークは旅行費用が高いから(31.1%)」が9.7ポイント増加、「家でのんびりしたいので(26.1%)」が5.1ポイント増加、「収入が減ったので支出を控える(14.5%)」も4.9ポイント増加し、前年に比べ感染症以外の理由が上位を占める結果となりました。2021年、2022年に最も多かった「新型コロナウイルス感染症がまだ収束していないから/拡大の懸念があるから(13.2%)」は前年から26.2ポイント減と大幅な減少となり、順位を下げました(図表8)。
(図表6)GWの旅行意向 (単一回答 N=20,000)
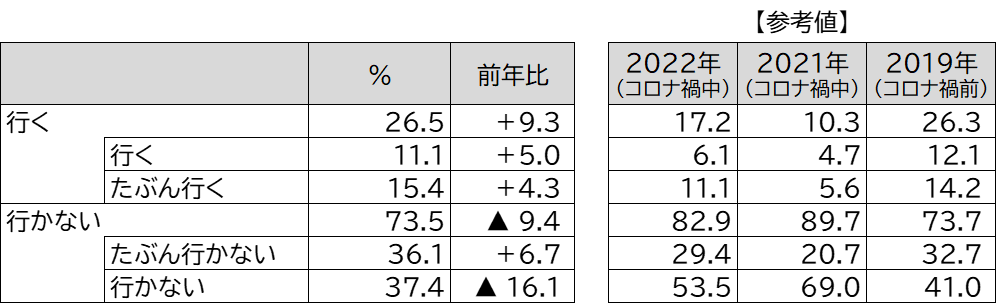
* 2020年は未発表のためデータなし
(図表7)GWの旅行意向(性年代別 単一回答 N=20,000)
(図表8)今回のGW旅行に行かない理由(複数回答 N=14,689)
4.今年のゴールデンウィークの旅行者の予測
国内旅行者数は2,450万人(対前年153.1%)、対2019年102.0%まで回復
海外旅行者数は20万人で、緩やかに回復
GW期間(2023年4月25日~5月5日)の旅行動向については、各種経済指標、交通機関各社の動き、宿泊施設の予約状況、各種定点意識調査などをもとに算出し、総旅行者数は2,470万人、総旅行消費額は9,040億円と推計します。
国内旅行者数は2,450万人(対22年153.1%、対19年102.0%)、国内旅行平均費用は34,800円(対22年100.9%、対19年96.9%)、総国内旅行消費額は8,526億円で、ほぼコロナ禍前の状態に回復すると考えられます。一方、海外旅行者数は20万人(対22年400.0%、対19年21.5%)ですが、2019年のGWは令和天皇即位に伴い、4月27日~5月6日が10連休となっていたため例年に比べ海外旅行が活況を呈していました。コロナ禍前までの10年間の海外旅行者数は約50万人~60万人で推移しており、その平均と比較すると3割超回復しているといえます。海外旅行平均費用は257,000円(対19年比95.9%)、総海外旅行消費額は514億円(同20.6%)です。物価高や円安、燃料高騰、国際線座席提供数の縮小(対19年約60%)*4などの影響もあり、国内旅行に比べると海外旅行の回復は緩やかです。具体的な傾向については、次章以降で述べる通りです。
*4:OAG(オフィシャル・エアライン・ガイド)「Capacity Report」より
5.今年のゴールデンウィークの旅行の傾向
国内は中・近距離志向、海外の人気の行き先は「ハワイ」「韓国」
アンケートの事前調査で「GWに旅行に行く/たぶん行く」と回答した2,060名を抽出し、旅行内容について詳細を聞きました。全体的な傾向として、コロナ禍では居住地域近隣を中心とした旅行が多かったのに対し、昨年のGWは行動の制約が求められず、新幹線や飛行機を利用した遠方への旅行意欲が強く表れる傾向がみられました。一方、今年は物価高の影響などもあり、再び居住地域近隣を中心とした比較的手ごろな距離の旅行先に行く傾向がみられます。具体的な旅行内容は以下のとおりです。
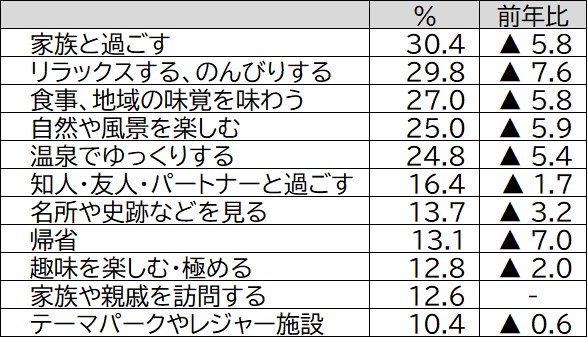
旅行に行く目的や動機(全体):「家族と過ごす(30.4%)」が最も多く、次いで「リラックスする、のんびりする(29.8%)」、「食事、地域の味覚を味わう(27.0%)」「自然や風景を楽しむ(25.0%)」「温泉でゆっくりする(24.8%)」となり、上位の傾向は昨年と変わっていません(図表9)。
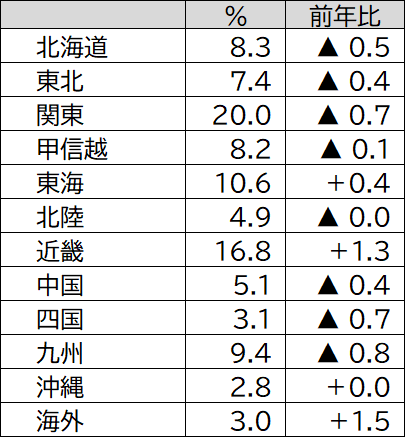
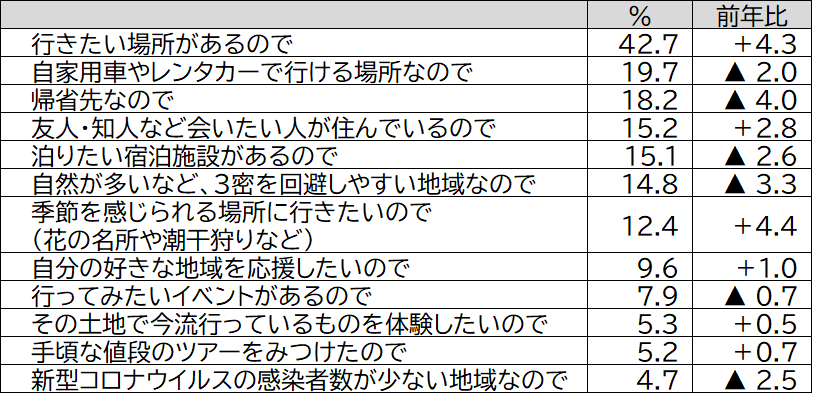
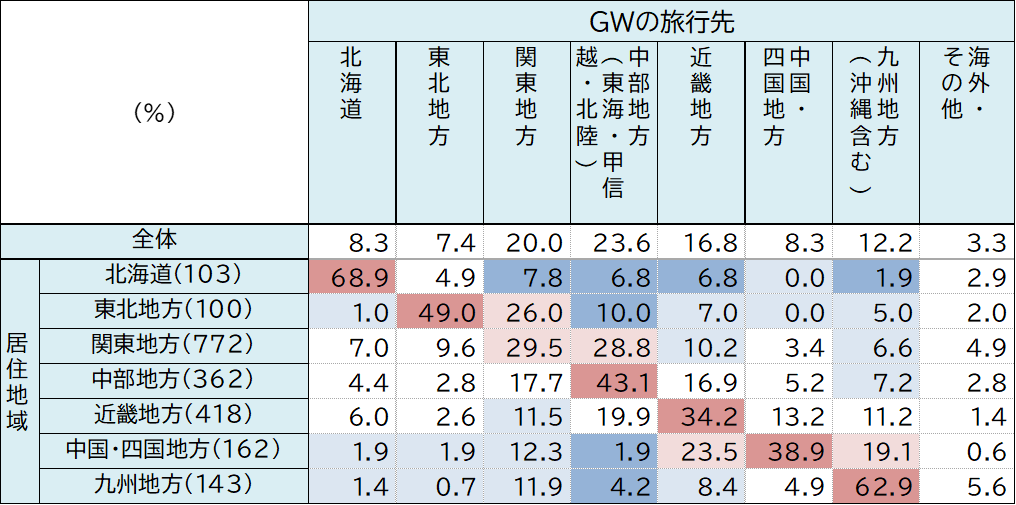
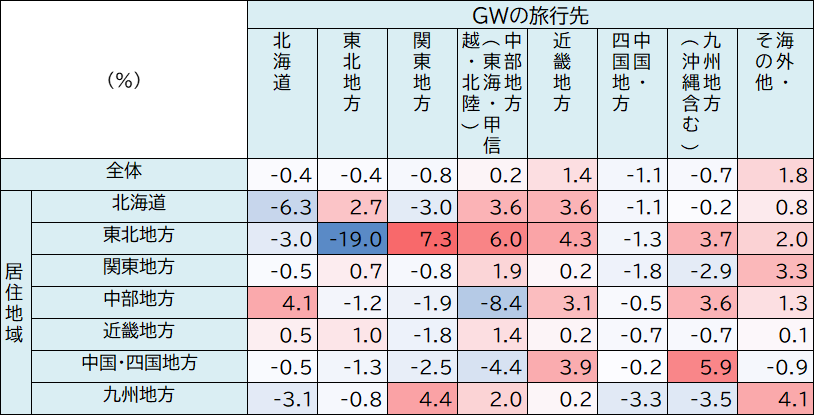
旅行先(国内):「関東」が20.0%で最多となり、次いで「近畿(16.8%)」「東海(10.6%)」「九州(9.4%)」となっています。また「海外」と答えた人も3.0%いました(図表10)。その旅行先を選んだ理由としては、「行きたい場所があるので(42.7%)」が最も多く、前年に比べ4.3ポイント増加しました。一方で、「自家用車やレンタカーで行ける場所なので(19.7%)」は2.0ポイント減少、「帰省先なので(18.2%)」は前年より4.0ポイント減少、「自然が多いなど、三密を回避しやすい地域なので(14.8%)」は3.3ポイント減少しました。感染症対策を優先する割合は昨年に続き低下傾向にあるものの、一定数の人は重視していると考えられます(図表11)。居住地別に旅行先を見ると、旅行先と居住地が同じ地方である域内旅行の割合は、「北海道(68.9%)」「九州(62.9%)」の2地域では60%を超える一方で、「関東」は29.5%となりました (図表12)。また前年と比較すると、近畿地方以外のすべての地域で域内旅行の割合は減少しており、居住地域外への旅行が増えています(図表13)。コロナ禍中は感染症対策として居住地域内の旅行先が選ばれていましたが、今年は居住地域外を目的地とする人が増える傾向にあります。
旅行先(海外):回答数は少ないものの、傾向をみると、人気が高いのはハワイ、続いて韓国となっています。
ここからは国内旅行を実施すると回答した1,992名に聞きました。
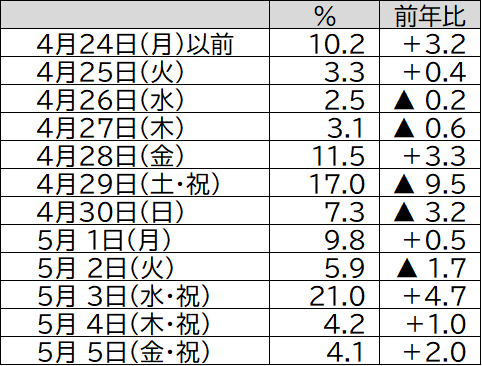
旅行の出発日:5連休の初日である「5月3日(水・祝)(21.0%)」が最も多くなっています。次いで「4月29日(土・祝)(17.0%)」「4月28日(金)(11.5%)」の順となっており、5月1日(月)、2日(火)を休んで長い連続休暇とする人もいることが考えられます(図表14)。
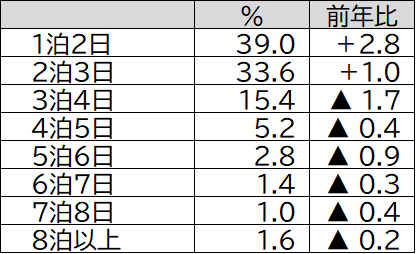
旅行日数:「1泊」が39.0%で前年から2.8ポイント増加し、最も多い結果となりました。「2泊(33.6%)」は1.0ポイント増加しましたが、「3泊(15.4%)」以上はすべて減少しており、前年と比べ旅行日数は減少傾向となっています(図表15)。
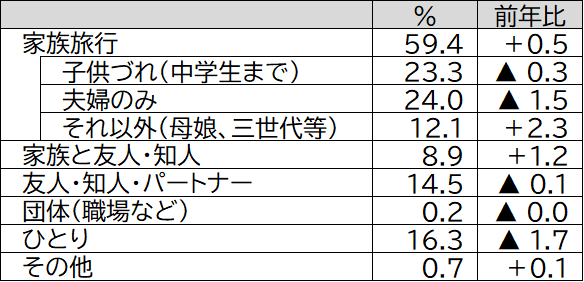
同行者:「夫婦のみ」が24.0%で最も多いものの、前年より1.5ポイント減少、次いで「子供づれ(中学生までの子供がいる)の家族旅行(23.3%)」も0.3ポイント減少しました。一方で、「(母娘、三世代等の)その他の形態の家族旅行(12.1%)」は2.3ポイント増加し、これらを加えた家族旅行の合計は59.4%となり、前年より0.5ポイント増加しました。「家族と友人・知人(8.9%)」も1.2ポイント増加する一方で、コロナ禍で増加傾向にあった「ひとり(16.3%)」は1.7ポイント減と2年連続で減少しました。感染対策として少人数の家族やひとりの旅行が中心だった傾向から、同行者の対象が拡大されつつあります(図表16)。
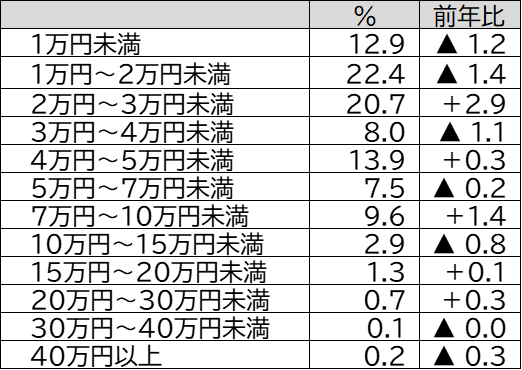
一人当たりの旅行費用:「1万円~2万円未満」が22.4%で最も多いものの、前年から1.4ポイント減少しました。続く「2万円~3万円未満(20.7%)」は前年より2.9ポイント増加、「1万円未満(12.9%)」は1.2ポイント減少しました(図表17)。
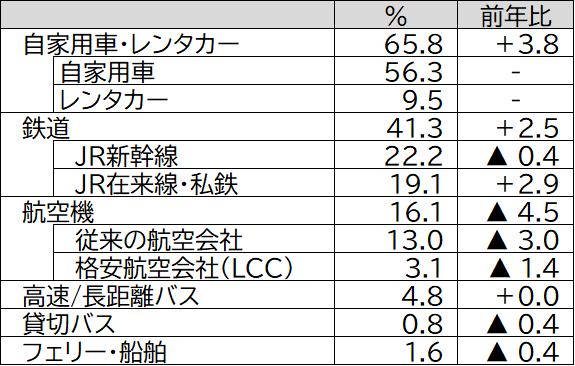
利用交通機関:「自家用車・レンタカー」が65.8%で前年より3.8ポイント増加し最も多い結果となりました。「鉄道全体」は41.3%となり、前年より2.5ポイント増加しました。内訳をみると「JR新幹線(22.2%)」は前年より0.4ポイント減少、「JR在来線・私鉄(19.1%)」は2.9ポイントの増加となりました。「航空機全体」は16.1%となり、前年より4.5ポイント減少しました(図表18)。
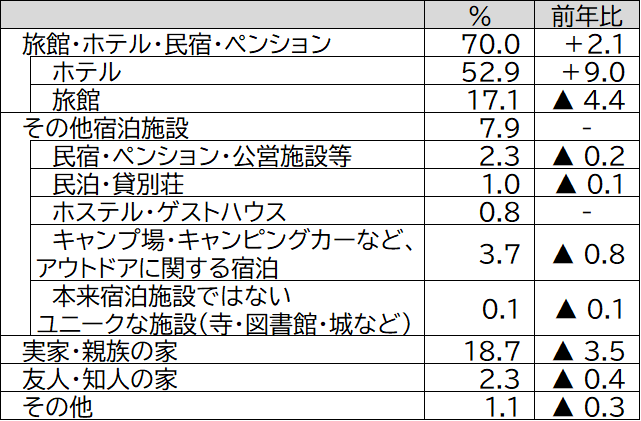
利用宿泊施設:「ホテル」が52.9%で最も多く、前年より9.0ポイント増加しています。次いで「実家や親族の家(18.7%)」は3.5ポイント減少、「旅館(17.1%)」は4.4ポイント増加となっています。感染対策として、これまでは「キャンプ場・グランピング・キャンピングカー・車中泊など、アウトドアに関する宿泊(3.7%)」や「民泊・貸別荘(1.0%)」が増加傾向にありましたが、いずれも減少する結果となりました(図表19)。
(図表9)旅行目的や動機(複数回答 N=2,060)
(図表10)旅行先(単一回答 N=2,060)
(図表11)その旅行先を選んだ理由(単一回答 N=2,060)
(図表12)回答者の居住地別 GWの旅行先(地域別、単一回答 N=2,060)
(図表13)回答者の居住地別GWの旅行先の前年増減比(地域別 単一回答)
(図表14)旅行出発日(単一回答 N=1,992)
(図表15)旅行日数(単一回答 N=1,992)
(図表16)旅行の同行者(単一回答 N=1,992)
(図表17)一人当たりの旅行費用(単一回答 N=1,992)
(図表18)利用交通機関(複数回答N=1,992)
(図表19)利用宿泊施設(単一回答 N=1,992)
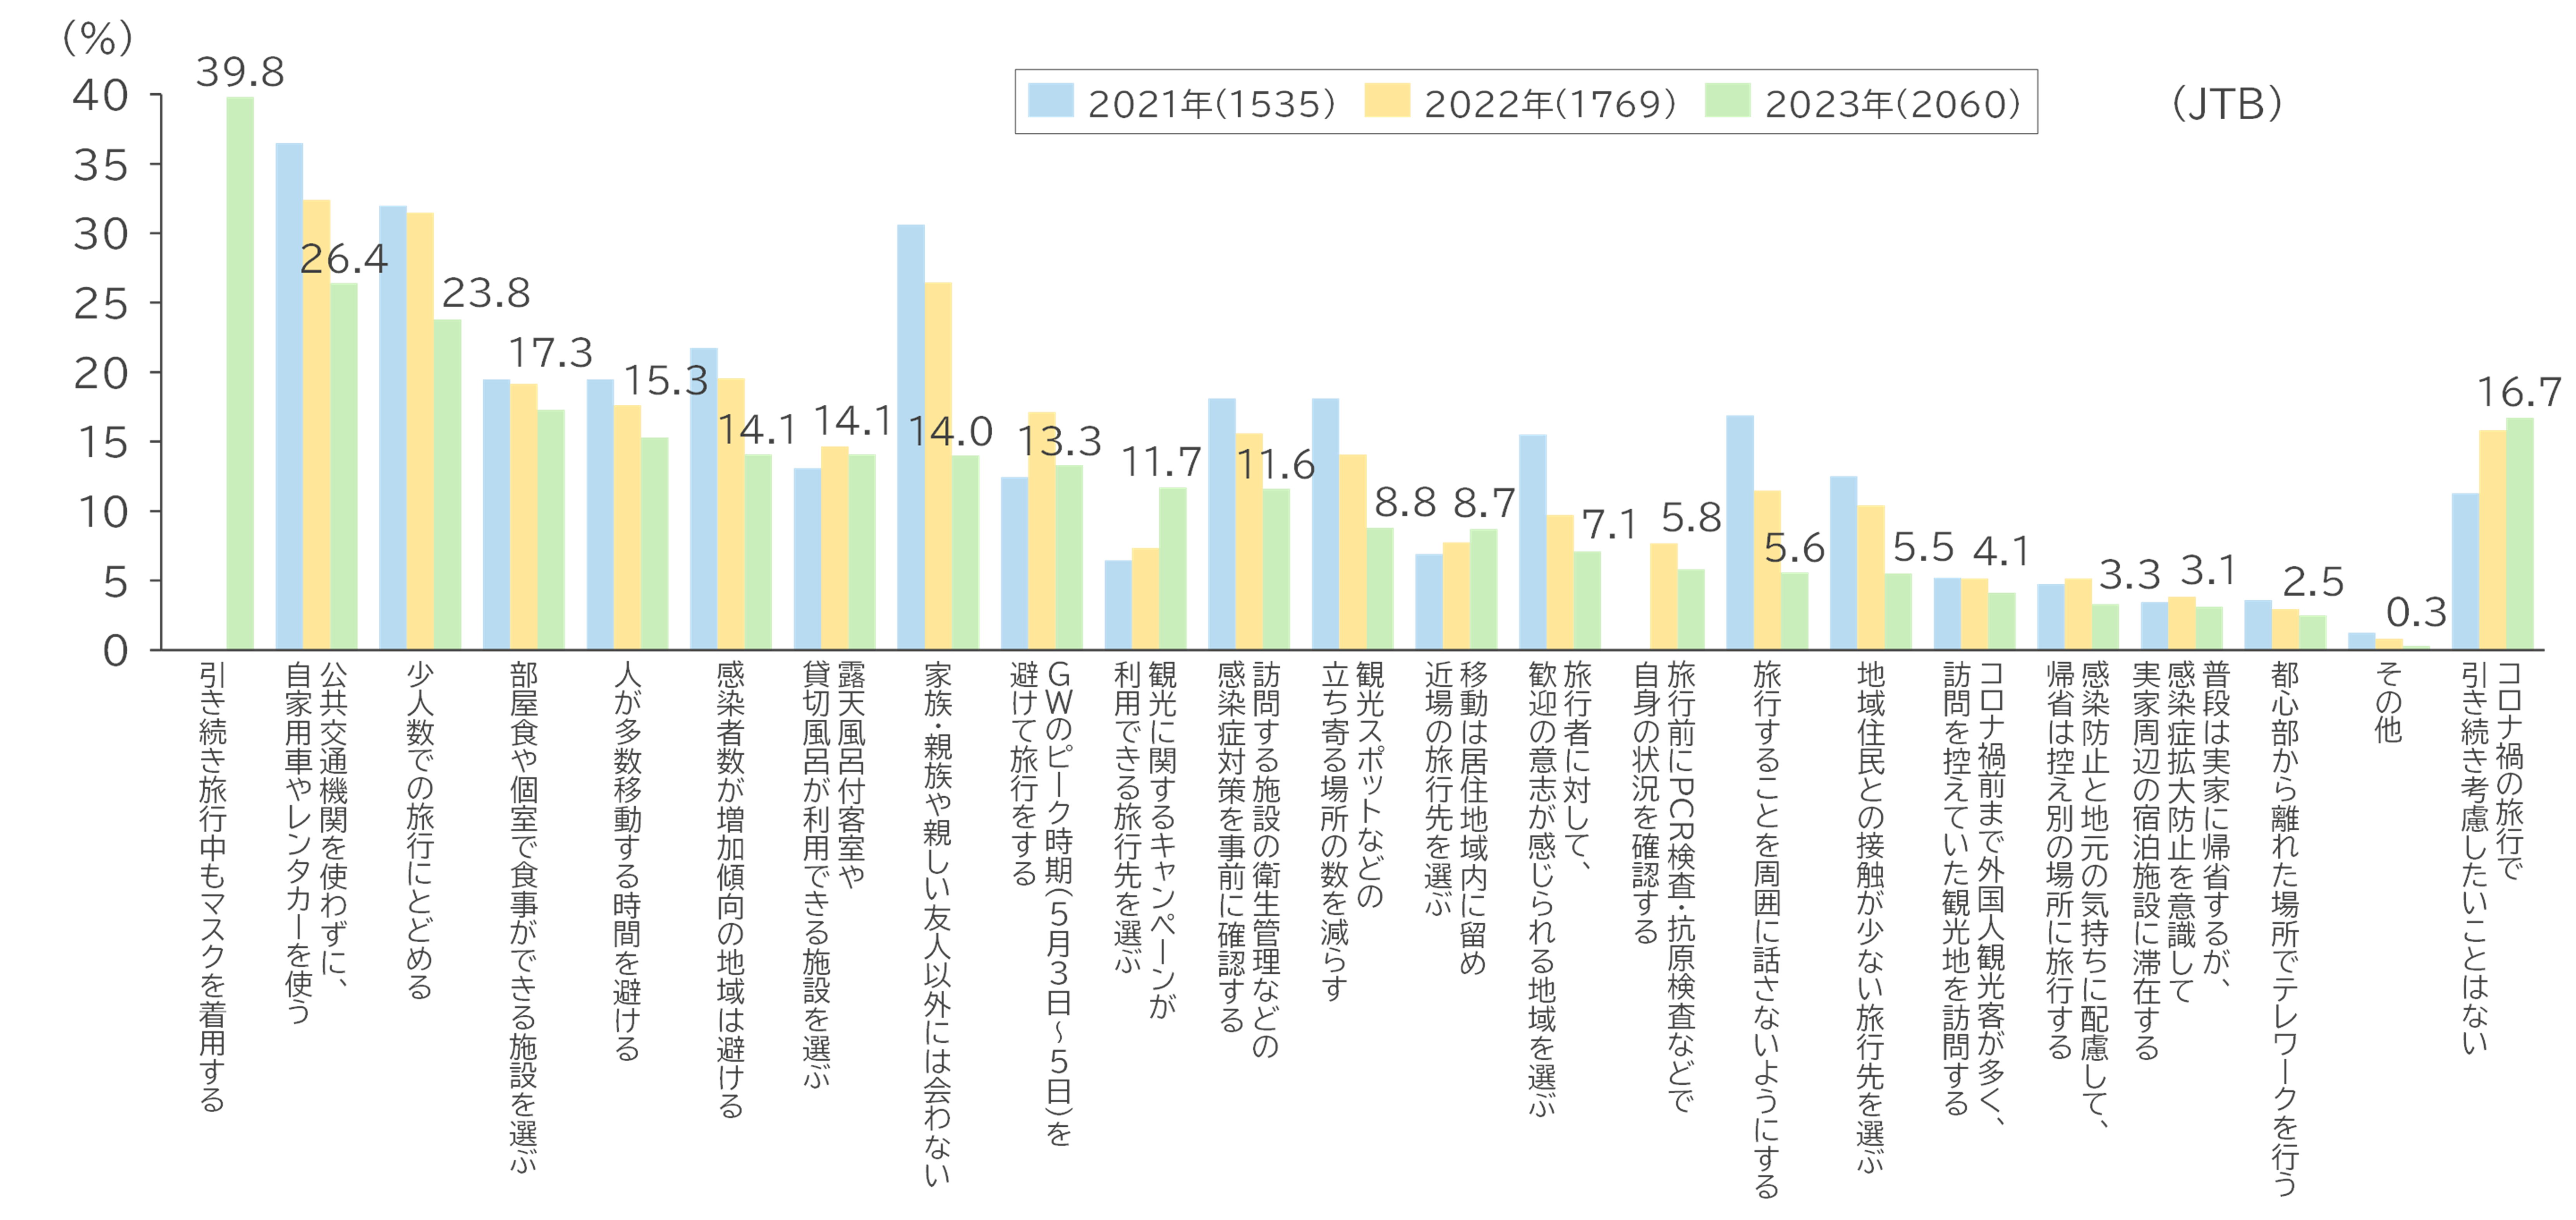
6. 新型コロナ感染防止への意識は低下しつつも対策は継続
2023年3月13日からマスクの着用が個人の判断となり、5月8日には新型コロナの感染症状の分類が「2類」から「5類」に引き下げられるという状況において、旅行予定者が感染防止にどのような意識があるのかを聞きました。
特に考慮することとして、「引き続き旅行中もマスクを着用する」が39.8%で最も多く、次いで「公共交通機関を使わずに、自家用車やレンタカーを使う(26.4%)」、「少人数での旅行にとどめる(23.8%)」、「部屋食や個室で食事ができる施設を選ぶ(17.3%)」「人が多数移動する時間を避ける(15.3%)」となりました。ほとんどの項目が前年に比べ減少する中、「観光に関するキャンペーンが利用できる旅行先を選ぶ(11.7%)」は前年より4.4ポイントの増加、「旅行者に対して、歓迎の意思が感じられる地域を選ぶ(8.7%)」は同1.0ポイントの増加となりました。引き続き新型コロナへの対策は取りつつも、キャンペーンなどへの期待も伺えます(図表20)。
(図表20)GWの旅行において特別に考慮すること(複数回答 N=2,060)
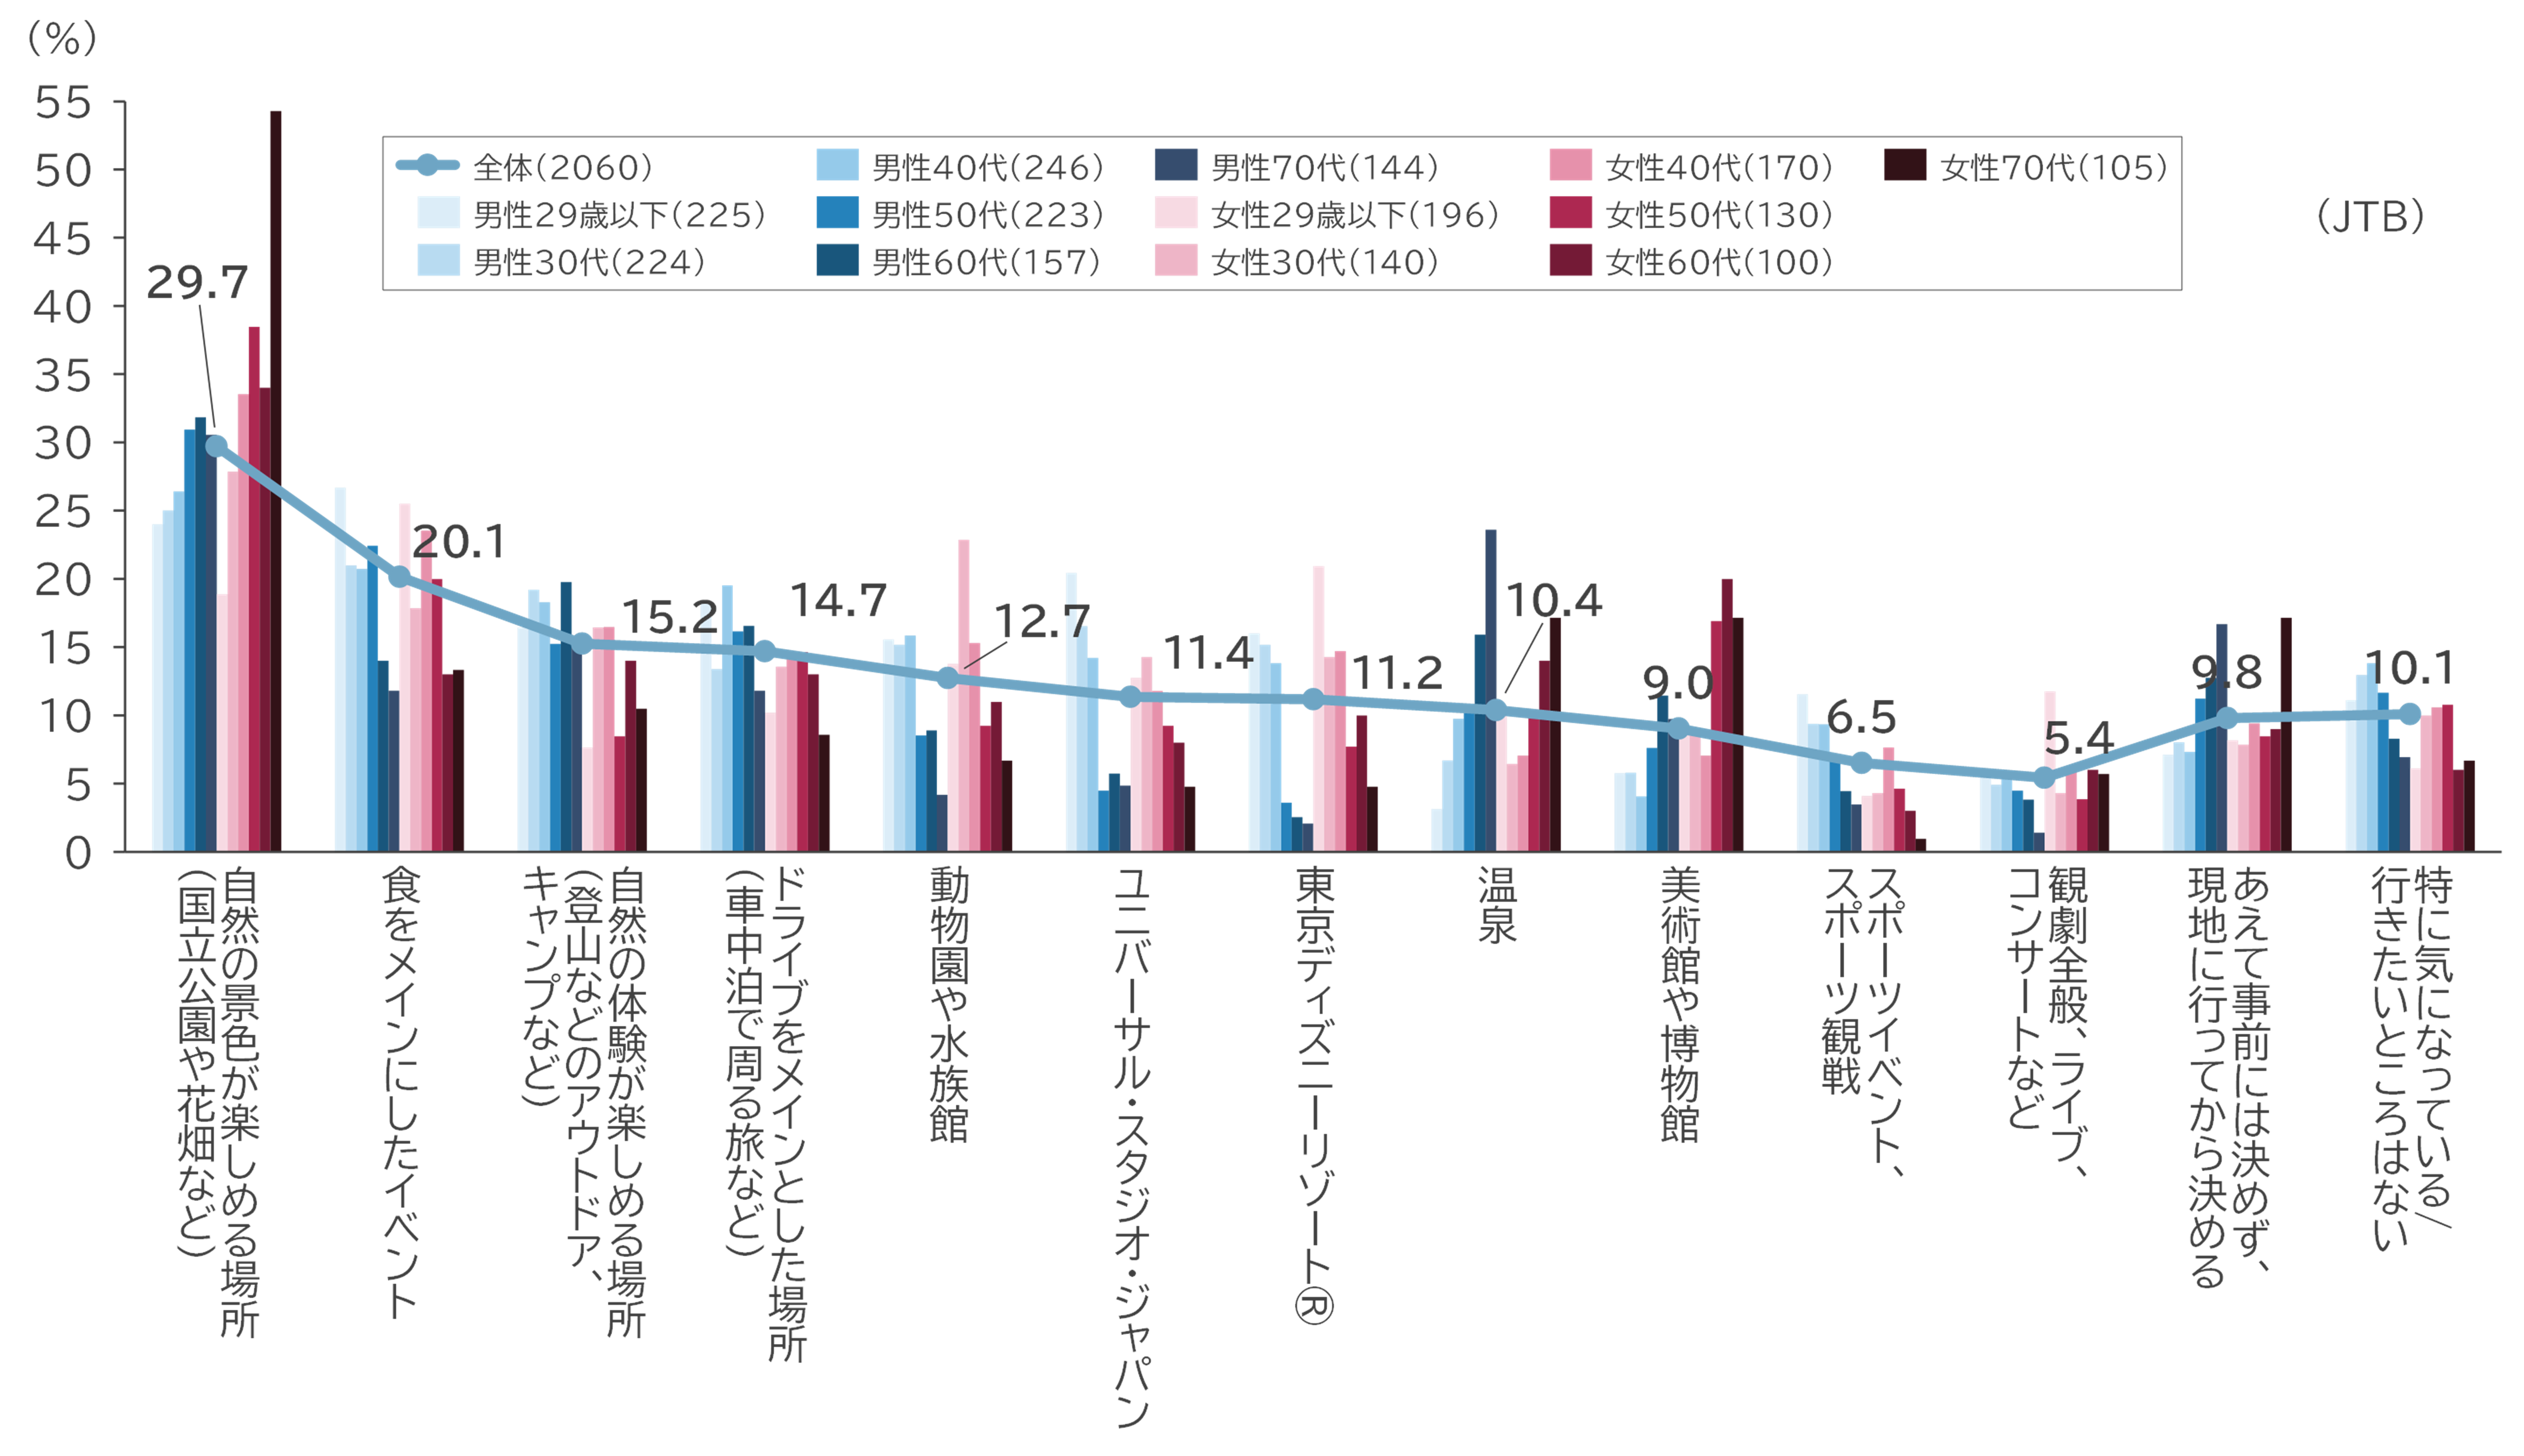
7.今年のゴールデンウィークで気になるところは「自然が楽しめる場所」「食をメインとしたイベント」
最後に、GWに出かける場所として気になっているところを聞きました。その結果、最も多かった答えは、「自然の景色が楽しめる場所(国立公園や花畑など)(29.7%)」、次いで「食をメインにしたイベント(20.1%)」「自然の体験が楽しめる場所(登山などのアウトドア、キャンプなど)(15.2%)」となりました。これまで自粛や中止を余儀なくされたイベントへの期待もみられます。選択肢が異なるため参考値となりますが、「特に気になっている/行きたいところはない(10.1%)」は前年の調査の18.3%から8.2ポイント減少しており、全体的に旅行意欲の高まりがうかがえます(図表21)。
JTBの宿泊・国内企画商品の予約状況をみると、前年と比べ各方面軒並み大幅な増加で、新幹線や航空機を利用した遠方への旅行が好調です。行先としては、東京ディズニーリゾート®を含む関東、ユニバーサル・スタジオ・ジャパンを含む関西が特に好調で、北海道、沖縄などの遠方も人気があります。出発日としてはGW後半に人気が集中しており、特に5月3日、次いで4日出発の商品のシェアが高い状況で、間際予約を含めると、GW直前まで伸びることが期待できそうです。JTBの海外企画商品については、1位がハワイ、2位が台湾、3位が韓国となっています。出発日としては5月3日、次いで4月29日出発の商品のシェアが高い状況です。
(図表21)今年のGWに出かける場所として気になっているところ(複数回答 N=2,060)
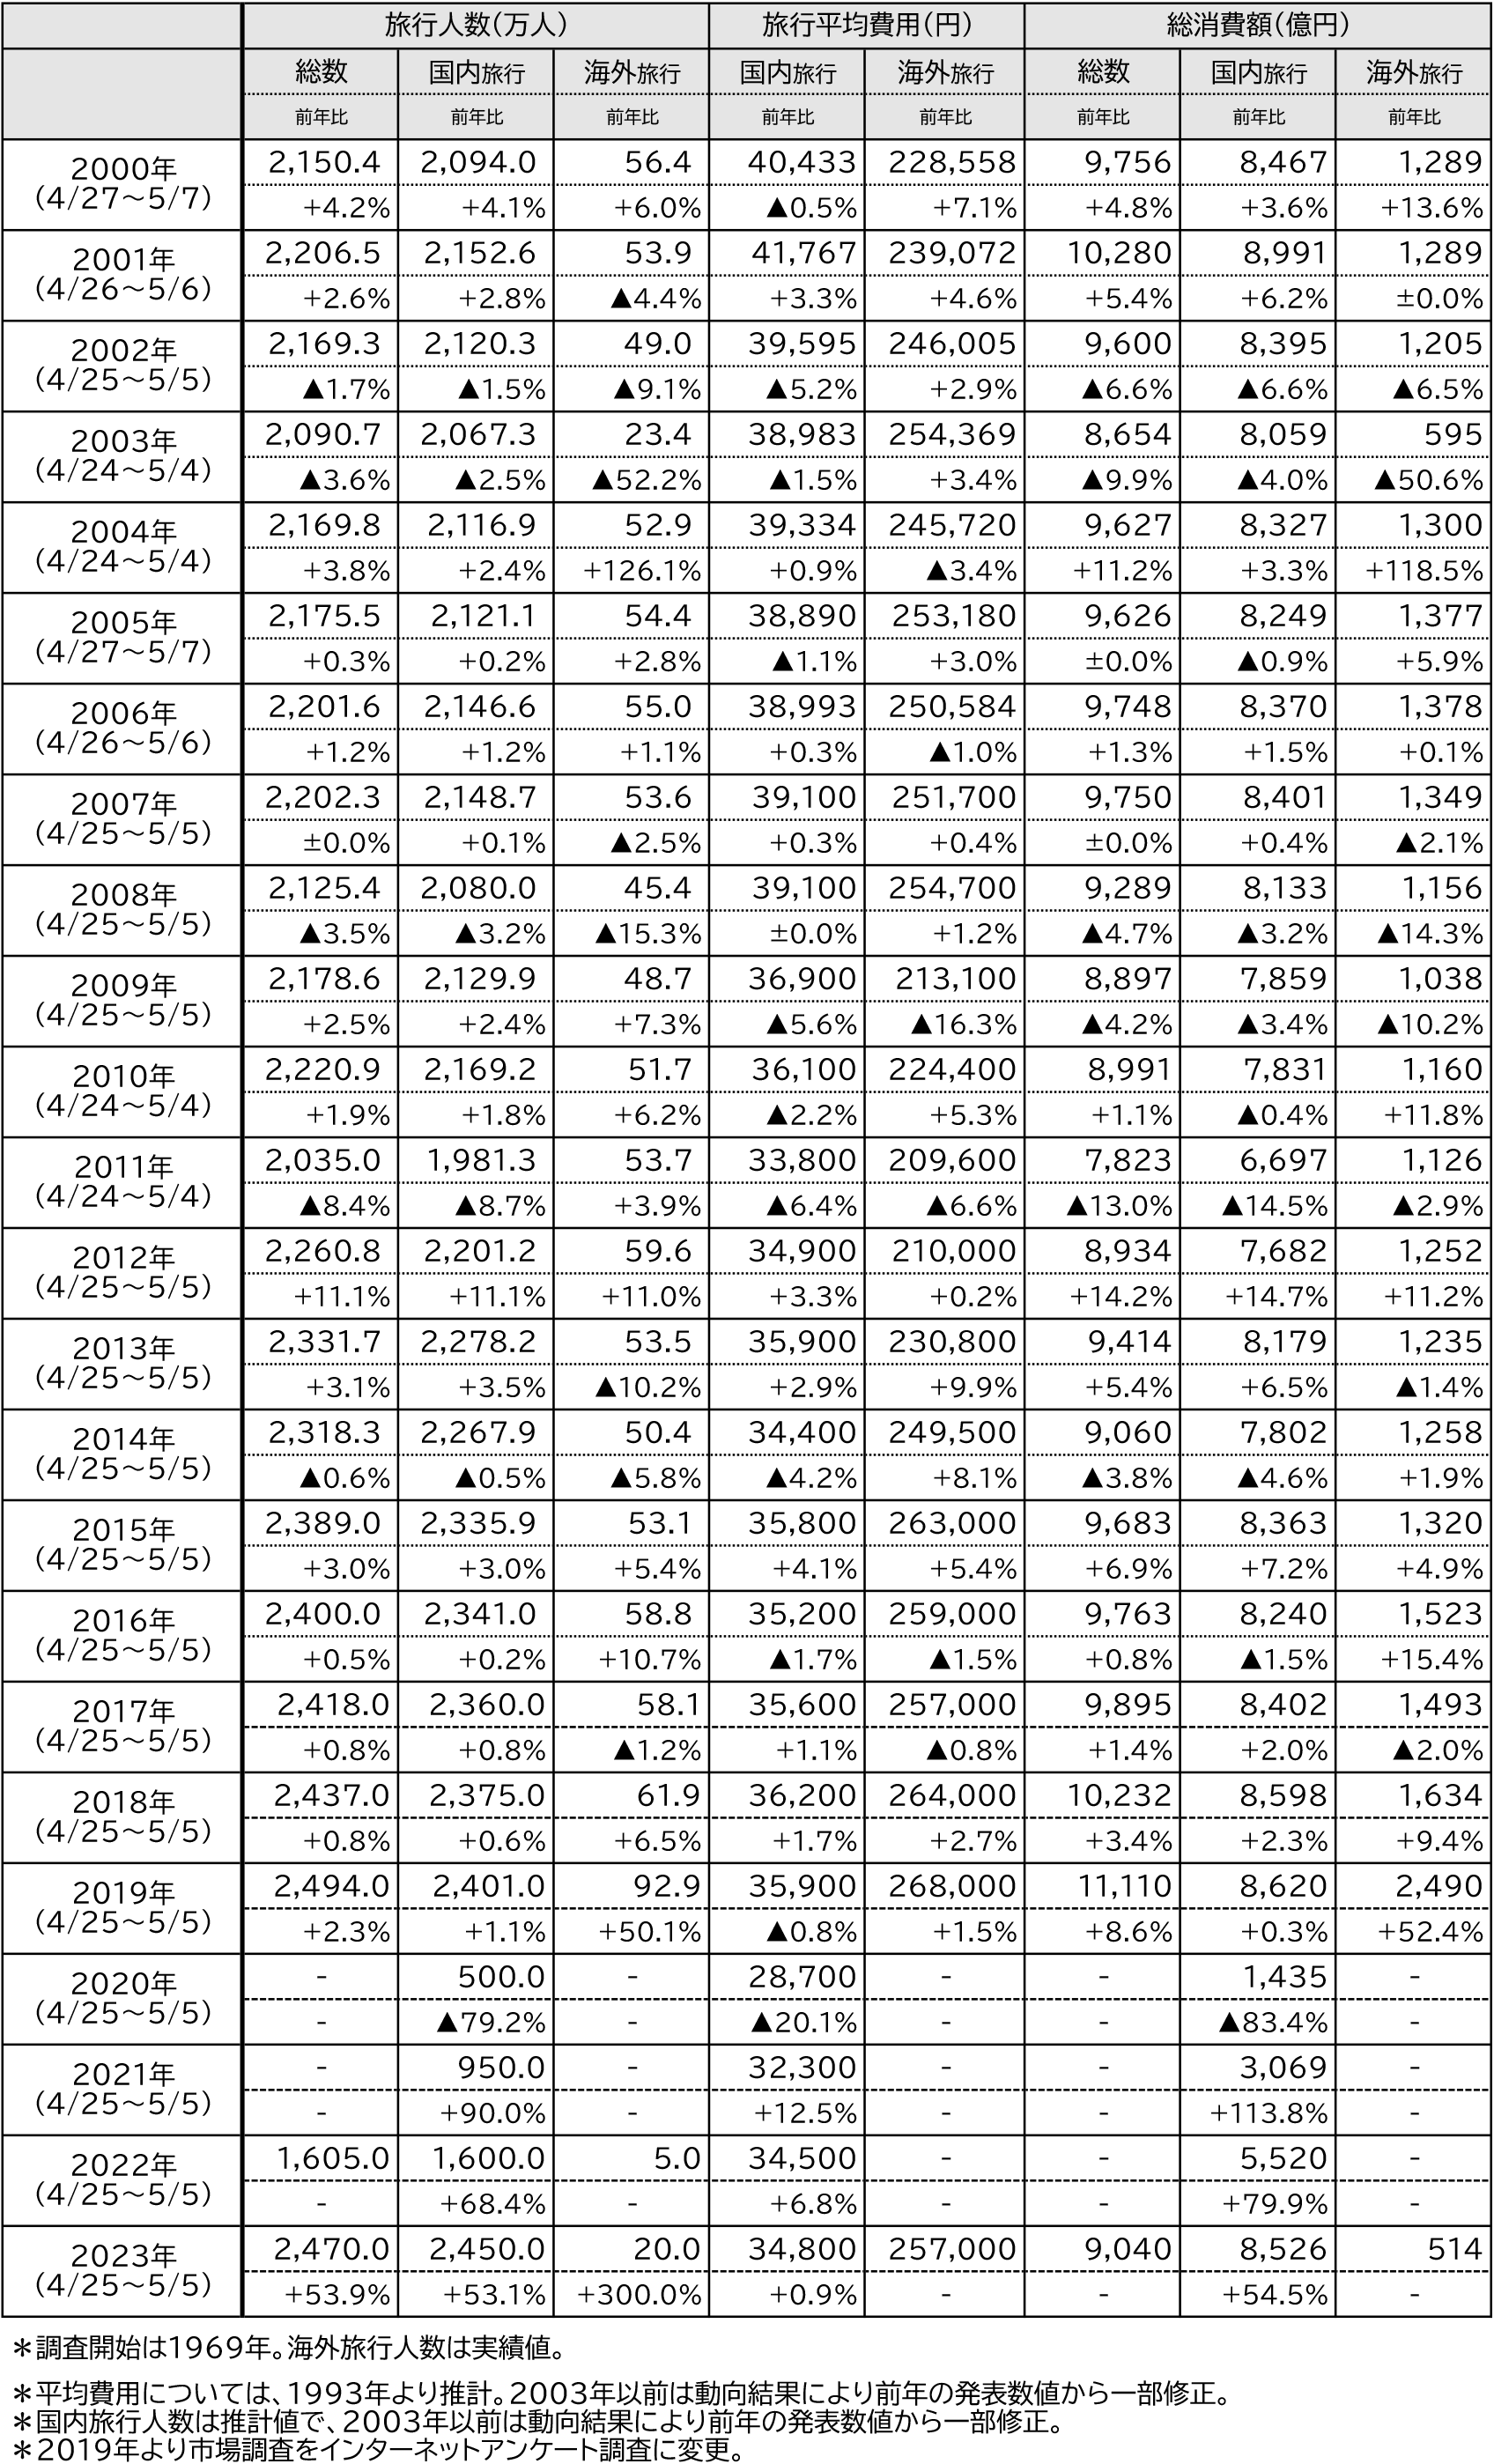
(図表22)「GWの旅行動向」推計数値の推移
JTB広報室 03-5796-5833(東京) 06-6260-5108(大阪)