Travel Trends for Year-end/New-Year 2019/2020 (Dec. 23, 2019 _ Jan. 3, 2020)
JTB Corp.
Nine-days of consecutive holidays during
Year-end/New-year period
No. of overseas travelers set to reach all-time high of 0.762 million
Total no. of domestic travelers: 29.266 million (-2.1% y-o-y)
Total no. of overseas travelers: 0.762 million (+0.3% y-o-y)
JTB Corp. has just published a survey of forecast travel trends involving at least one overnight stay for the year-end/New-Year season from December 23, 2019 through to January 3, 2020.
The survey was based on a questionnaire survey of 1,074 respondents about travel trends, economic indices, industry and economic trends, the status of airline reservations, and the status of bookings at JTB Group companies, from which estimates have been compiled. The results of this, the 51st such survey since the first in 1969, are as follows (Table 1).
Table 1: Estimates for Year-end/New-Year 2018/2019 Travel Trends
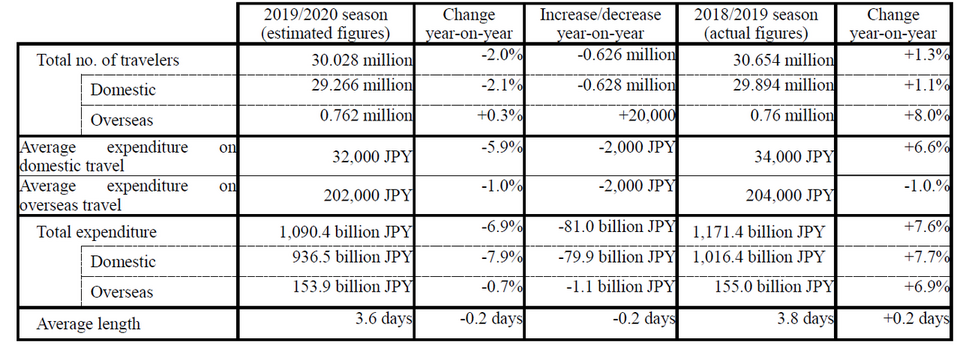
Notes on the table:
- Numbers of travelers are cumulative totals; average expenditures are per person.
- Numbers of domestic travelers are those making overnight stays (only for tourism and trips to the family home).
- Numbers of overseas travelers are for all those departing Japan (including business travel).
- Domestic travel average expenditures comprise all costs incurred during travel, including transport, accommodation, meals and souvenirs.
- Overseas travel average expenditures include fuel surcharges, accommodation, transport and meals at the destination.
- Year-on-year changes are rounded to the nearest first decimal point.
Socioeconomic Environment and Consumer Trends
- Socioeconomic environment surrounding travel and leisure consumption
Looking at the recent condition of the economic environment surrounding Japan, exports in October were down 9.2% over the same month in the previous year, marking the eleventh consecutive month for exports from Japan to decrease, and a scale of decrease that was the largest for three years. Looking at share prices over the past one month, although there have been fluctuations impacted by progress in U.S.-China trade consultations and movements in the Hong Kong markets, the Nikkei Stock Average has remained largely above the 23,000 yen level (Fig. 1). In terms of exchange rates the yen has fluctuated only slightly against the dollar and euro since the beginning of the year (Fig. 2). Looking at the first-half financial statements of listed companies, while some companies have recorded record profits, more noticeable have been those companies that have recorded a year-on-year downturn in profits, with many companies leaving their full-year profit forecasts unchanged for the year ending March 31, 2020. However, the ratio of job openings to job applicants in September remained at a high level of 1.57 (seasonally adjusted value), albeit at 0.02 points below the level of the previous month.
According to the Economy Watchers Survey (*1) issued by the Cabinet Office in November the diffusion index (DI) for current conditions in October (*1) fell below the level of the previous month to 36.7, which is below the standard value of 50.0 and part of a downward trend that has been continuing since the beginning of the year (Fig. 3). In terms of the winter bonuses being paid out by major companies, increases in the shipbuilding, automobile and construction industries have driven the level of bonuses up year-on-year by 1.49% to their highest-ever level in monetary terms for the second consecutive year. However, the overall level of increase is less than that of the previous year (3.49%) (figure announced by Keidanren (Japan Business Federation), November 14).
In the travel trends questionnaire implemented by JTB, when asked about their motivation to spend on travel in the future, 13.6% of respondents indicated that they “would like to spend more” (down 2.5 points on the previous year), whereas those indicating that they “would like to spend less” accounted or 33.4%, which represents a 1.5 point increase. Those intending to “spend about the same” accounted for 53.0% of the total, up 0.9 points on the previous year. From these figures it can be seen that consumers have a strong motivation to reduce spending on travel (Table 2).
(*1) A diffusion index (DI) that expresses the results of a survey of people who are particularly sensitive to changes in the economy, including taxi drivers and owners of retail outlets.
Figure 1: Trends in the Nikkei Stock Average(November 1-30, 2019)
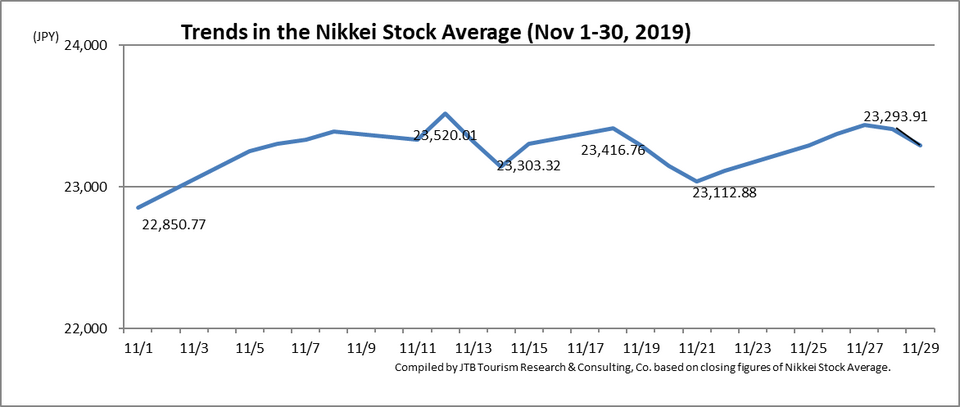
Figure 2: Trends in Foreign Exchange Rates(USD, EUR; Jan-Nov 2019) 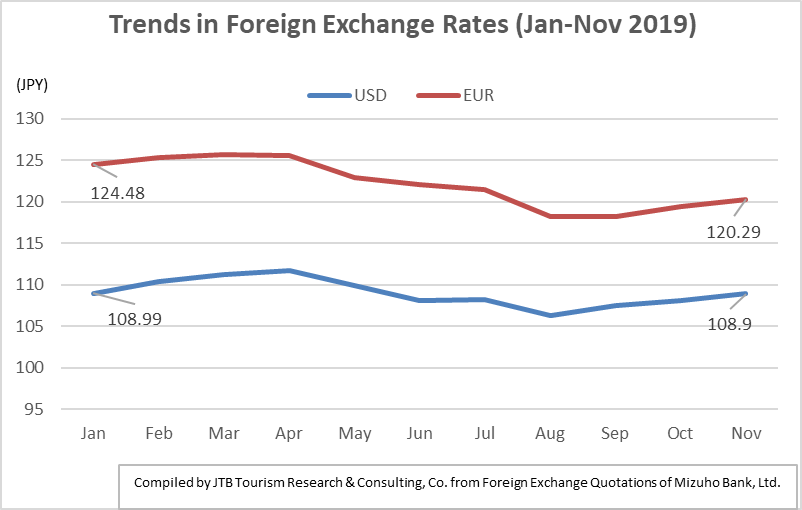
Figure 3: Trends in the Economy Watchers Survey (Jan-Oct 2019)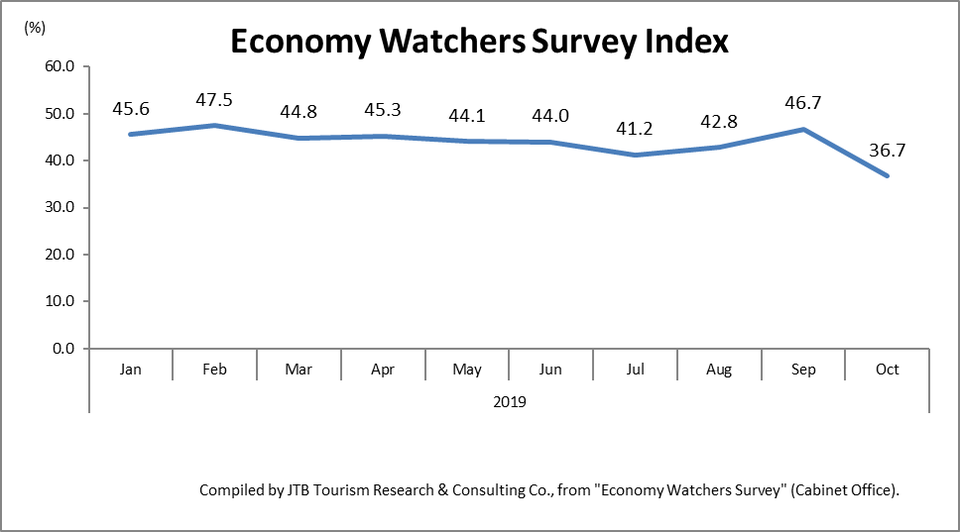
Table 2: Changes in Motivation to Spend on Travel in the Next Year (responses based on the month of the survey) (figures in parentheses indicate year-on-year % change)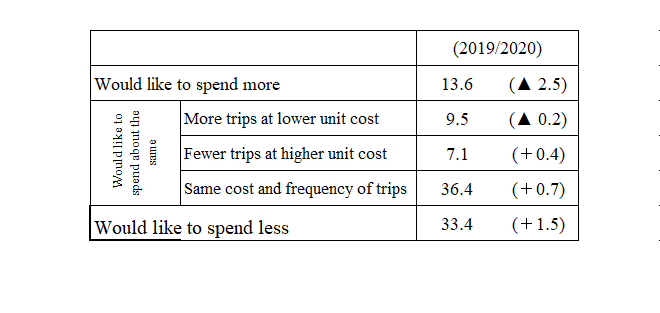
- Environment surrounding the year-end/New-year holiday period and desire for travel among consumers
In terms of how the dates fall for this year-end/New-year holiday period, although there is no three-day Christmas weekend as December 23 is no longer a national holiday, if people finish work on (Fri) December 27, it is possible that they could take nine consecutive days of holiday from (Sat) December 28 to (Sun) January 5.
According to the results of the abovementioned questionnaire, of the 20,000 people who were asked whether they would like to travel at the year-end/New-year period, including returning to the family home, a total of 20.0% indicated a desire to travel (11.1% indicating that they “will travel,” and 8.9% indicating that they “will probably travel”), which was 3.5 points down on the previous year. Those indicating that they would not travel this year (21.2% indicating that they “will probably not travel” and 58.9% indicating that they “will not travel”) represented 80.1% of the total, a 3.6-point increase on the previous year (Table 3). With regard to current lifestyle and travel, more people responded that their income and bonus had “decreased” than those who responded that they had “increased,” and more people also responded that they are attempting to “increase” their savings for the future. In terms of expenditure on year-end/New-year travel, judging from responses about “traveling for a shorter time” and “spending less money only on the bare essentials” it can be assumed that people are tending towards economization (Table 4).
Table 3: Desire for Travel During Year-end/New-year Period (single response)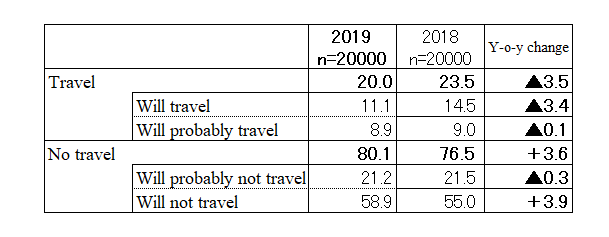
Table 4: Current Lifestyle and Travel During Year-end/New-year Period (multiple responses)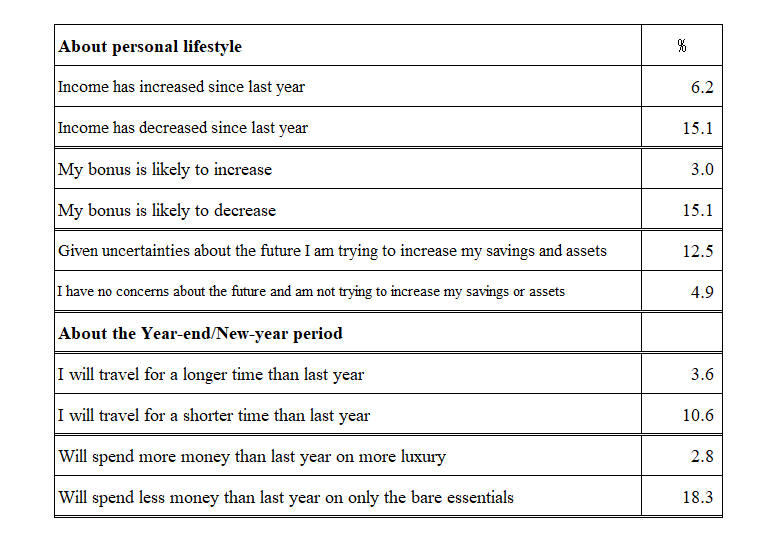
Anticipated Trends in Year-end/New-Year Travel 2019-2020
- Number of overseas travelers set to increase to 0.762 million (+0.3% y-o-y). Average expenditure on overseas travel is projected to be JPY202,000 (-1.0% y-o-y), with a peak date for departure of December 28 (Sat).
Since the beginning of 2019 the number of people traveling overseas has consistently outperformed the results for 2018, which itself was a record year. The cumulative total of travels for January to October 2019 shows a year-on-year increase of 6.9% at 16.73 million (figures according to announcement by Japan National Tourism Organization (JNTO) in November)(Fig. 4). The number of travelers in October was up just 1.0% year-on-year and since then the growth rate has fallen further, due to the impact of Japan-Korea relations and the demonstrations that are ongoing in Hong Kong. Although the number of people visiting Japan from Korea has continued to decrease since July, the number of Japanese people traveling to Korea was actually up year-on-year through to September and no sudden falls in traveler numbers have been seen. Overall, it is projected that the number of overseas travelers for this year’s year-end/New Year season will be slightly higher than last year, reaching 762,000.
Fuel surcharges are lower than last year and in terms of exchange rates the yen is slightly stronger than it was at the same time last year (Tables 5, 6). With regard to average expenditure on overseas travel, given the decrease in the fuel surcharge and the fact that overall people are seeking to rein in expenditure on travel, it is projected that expenditure will be down 1.0% year-on-year at JPY202,000.
The projected peak date for departure is December 28 (Sat). In terms of predictions for numbers of travelers by destination, the number of travelers to Korea and Hong Kong is projected to decrease, due to the reduction in available airline seats on routes to Korea as a result of the deterioration in Japan-Korea relations , and as a result of the continuing demonstrations in Hong Kong. However, other Asian destinations are expected to see an increase in visitor numbers, with Taiwan remaining perennially popular and Vietnam also performing well as new airline routes continue to be introduced. It is also anticipated that the number of travelers to North America and Australia will increase, as a result of increased airline seat capacity (Table 7).
Looking at the booking status of JTB overseas package tours, the top three destinations are: 1) Hawaii, 2) Guam/Saipan, and 3) Taiwan. In terms of the growth rate in reservations, Guam/Saipan are performing well, and European destinations such as Italy and Spain continue to be popular. In terms of Asian destinations Vietnam is enjoying popularity.
Figure 4: Year-on-Year Comparisons of No. of Departing Japanese Overseas Travelers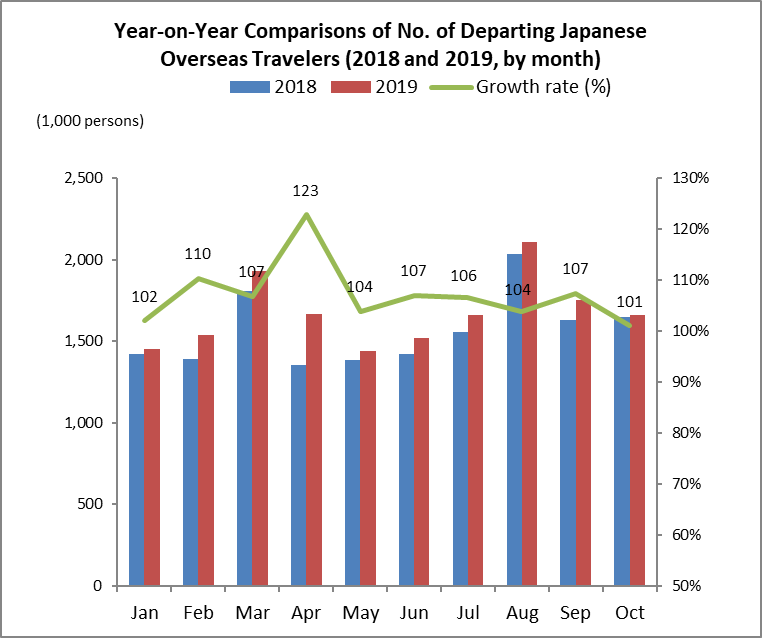
Source: Compiled by JTB Tourism Research & Consulting Co., based on data issued by the Japan National Tourism Organization
Table 5: Fuel Surcharges (for JAL, return flights from Japan; unit: JPY)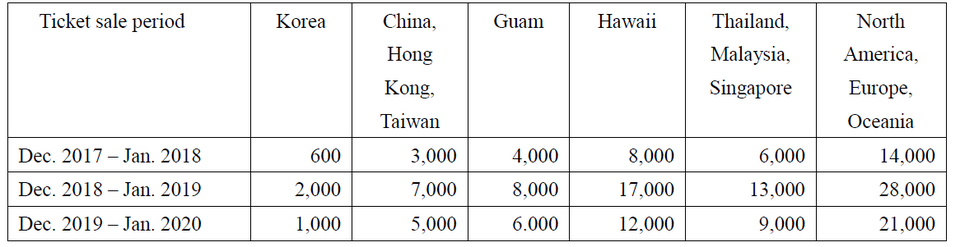
Table 6: Tokyo Foreign Exchange JPY Market/TTS rate, according to the Bank of Mitsubishi-Tokyo UFJ as of November 25 Each Year (Unit: JPY)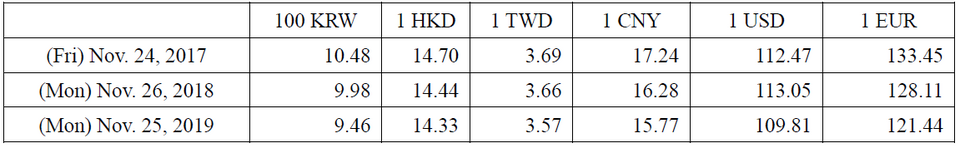
- Number of domestic travelers set to decrease to 29.266 million (-2.1% y-o-y). Average expenditure on domestic travel is projected to be JPY32,000 (-5.9% y-o-y).
According to the Statistical Survey of Overnight Travel conducted by the Japan Tourism Agency, the total number of overnight stays by Japanese guests for the January to October period of 2019 was up 0.3% year-on-year, thanks to good results in Golden Week this year. However, since June onwards figures have underperformed those of the previous year, with the preliminary figure for October alone down 2.8% year-on-year at 37.27 million overnight stays, which is largely due to the impact of typhoons and torrential rains. Although it is possible for people to enjoy nine consecutive days off this year-end/New-year holiday period, reflecting concerns about the economic situation and wage growth, it is projected that the number of domestic travelers will decrease 2.1% year-on-year to 29.266 million and average expenditure will decrease 5.9% year-on-year to JPY32,000.
According to the results of this year’s questionnaire, of the total number of people who responded that they would be traveling, 65.2% indicated that they would be traveling “with family.” In terms of the reasons for travel, the most popular response was “because I do every year” at 43.1%. Among those traveling as a “family” there were an increasing number of respondents planning to travel as a “married couple,” with other response categories showing decreases year-on-year (Tables 8 & 9). With regard to means of accommodation, 36.0% of respondents indicated that they would be using a hotel (up 3.8 points), but the number of people responding that they plan to stay in “husband or wife’s family home” was also up 1.3 points at 27.9%. It is thought that a factor behind these increases could be because a high proportion of the people who plan to travel as a married couple will be staying in hotels or at the husband or wife’s family home (Table 10). With regard to means of transportation, although the most popular option is still the car at 52.7%, there were increases in responses for various other means of transportation, including shinkansen, JR/private railway lines, and airplane. This could be due to the fact that there are fewer people traveling with children this year-end/New-year season, which looks likely to result in increased utilization of public transportation (Table 11).
In terms of trip length, there were increases in respondents expressing an intention to stay “1 night, 2 days” (30.5%, up 1.6 points) and “three nights, 4 days” (17.8%, up 2.2 points), and a decrease in plans for trips of “2 nights, 3 days” (27.7%, down 1.3 points)(Table 12). In terms of travel destination, Kanto (24.6%) and Tokai (10.5%) regions recorded a year-on-year increase (Table 13).
In the same survey, JTB asked respondents about “places of interest for the year-end/New-year season.” The most popular response was perhaps typical for the time of the year, namely “hot springs.” Looking at the areas of interest by the age of respondents, “art galleries and museums” are popular with the over-60s, and “theme parks” are popular with those in their teens (Fig. 6).
Looking at the current booking status of JTB domestic package tours, the peak departure date is likely to be around December 31, but as the year-end/New-year holiday period is long this year, departure dates are more spread out. Areas that are experiencing a boost in popularity compared to last year including the Ise-Shima region, which has attracted attention this year in relation to the new Imperial Reiwa era. There is an increasing tendency to leave domestic travel bookings until the last minute, and it could be the case that many people intend to keep an eye on rates at nearby hot spring resorts before making a reservation. In addition, the Japan Tourism Agency has announced a “Fukkou (Recovery) Discount” system for regions affected by typhoons No. 15 (Faxai) and No. 19 (Hagibis)(*2). This system provides up to a maximum of JPY5,000 support per person per night for travel or accommodation products of at least one night duration in affected areas. It is likely that this measure will boost demand for travel to these regions.
(*2): Eligible regions: Iwate, Miyagi, Fukushima, Ibaraki, Tochigi, Gunma, Saitama, Chiba, Tokyo, Kanagawa, Niigata, Yamanashi, Nagano and Shizuoka prefectures.
Figure 5: Trends in Retail Price of Regular Gasoline Over the Past Year(November 2018 to November 2019)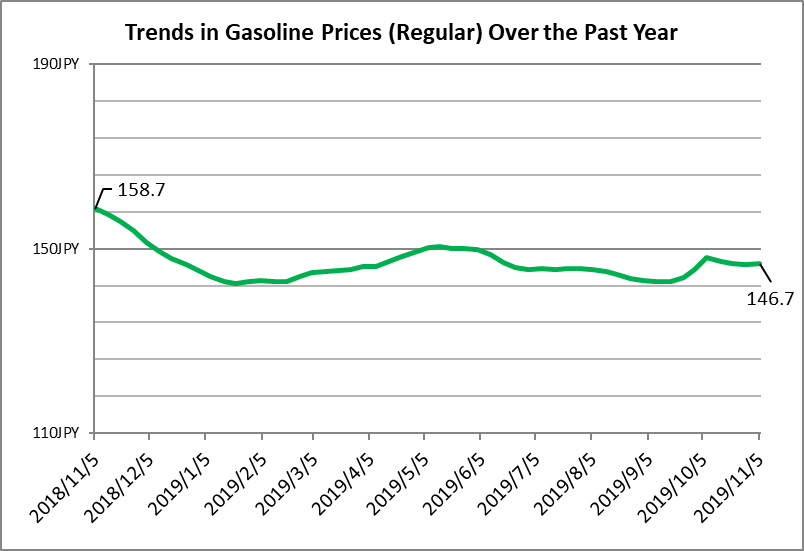
Source: Compiled by JTB Tourism Research & Consulting Co., based on data from the Ministry of Economy, Trade and Industry’s Petroleum Products Price Survey.
Figure 6: Areas of Interest for Year-end/New Year Season (multiple answers)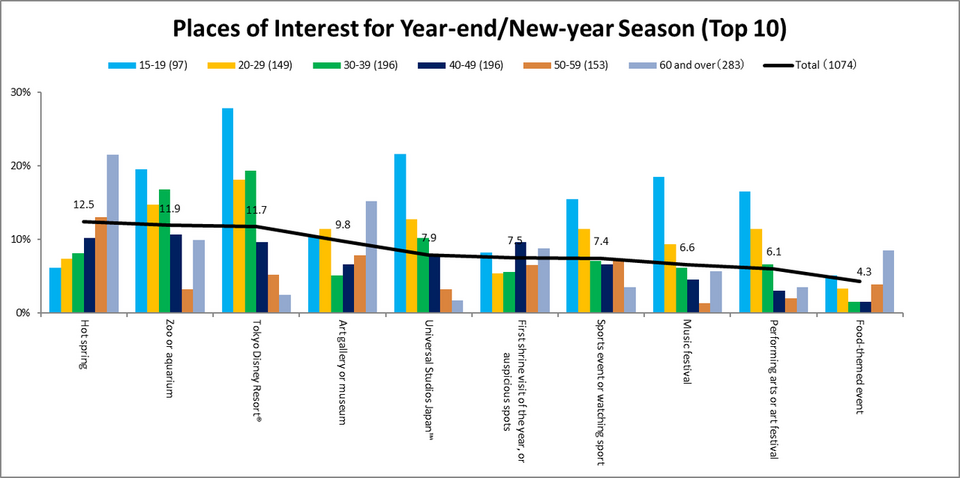
Survey Methodology
- Survey period: November 5 and 6, 2019
- Respondents: Males and females between the ages of 15 and 79
- Sample size: Pre-survey 20,000 persons, actual survey 1,074 persons(The main survey was implemented after selecting persons who responded in the pre-survey that they “plan to travel during the year-end/New-year period” and asking them to participate in the main survey)
- Content: Travel plans involving at least one night away from home between December 23, 2019 and January 3, 2020 (including overseas travel, but excluding trips for commercial or work purposes)
- Method: Internet questionnaire
* From this year the survey method has been changed from the previous method of “individual surveys conducted by survey staff using a questionnaire form on personal visits” to “internet questionnaire.” In the 2018/19 year-end/New-year market research both types of survey method were implemented in tandem and the year-on-year comparisons this year are based on the responses to the internet questionnaire in the previous year.
Table 7: Estimates of Overseas Travelers at the Year-end/New-Year Season (December 23, 2019 through January 3, 2020)
(Unit: 000s) 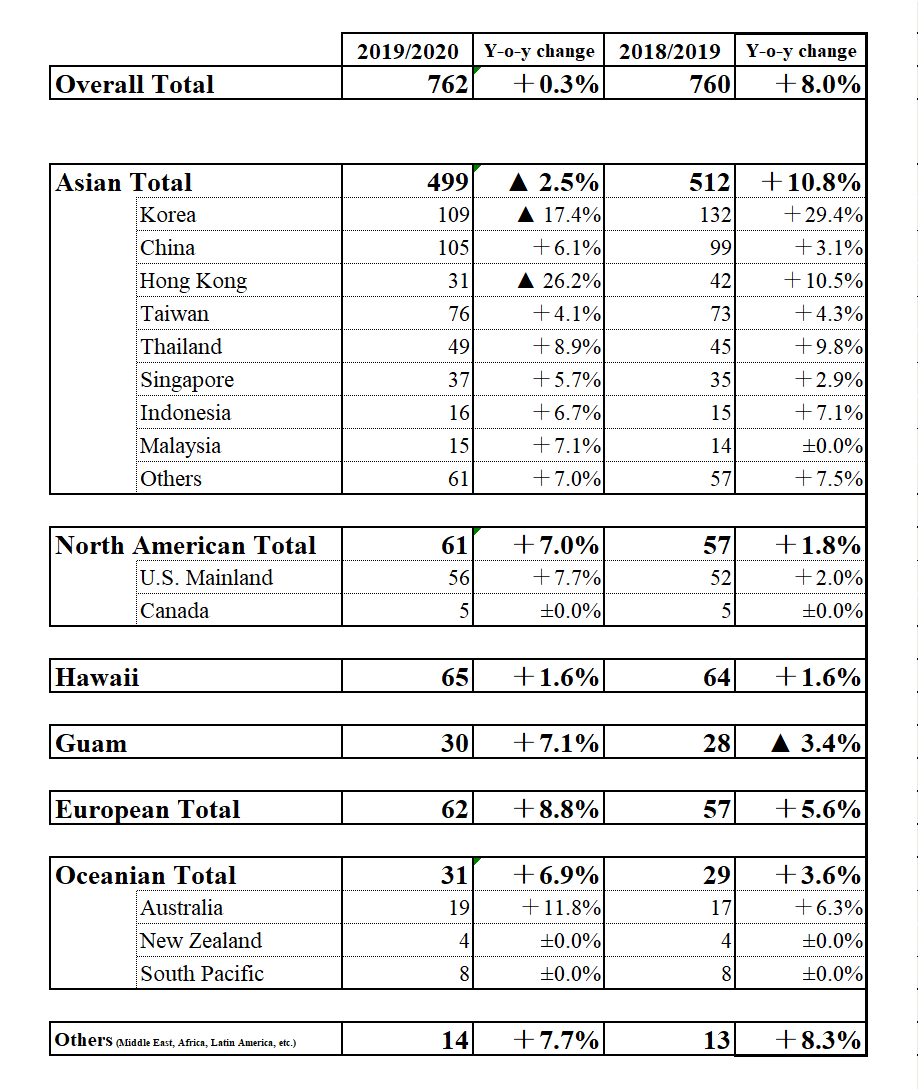
Results of the Survey (Tables 8 to 15)
Table 8: Travel Companions (single answers) 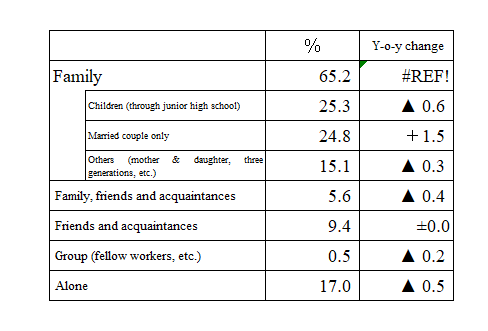
Table 9: Reasons for Travel(multiple answers)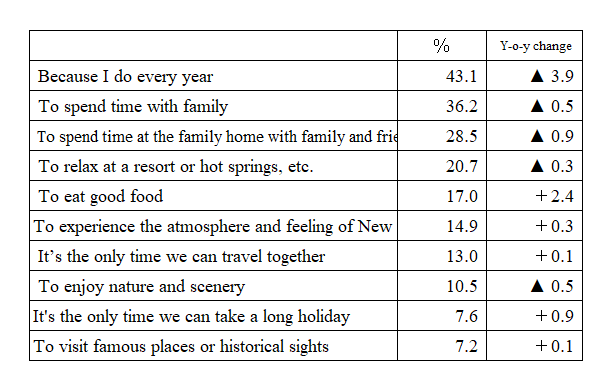 Table 10: Means of Accommodation(single answers)
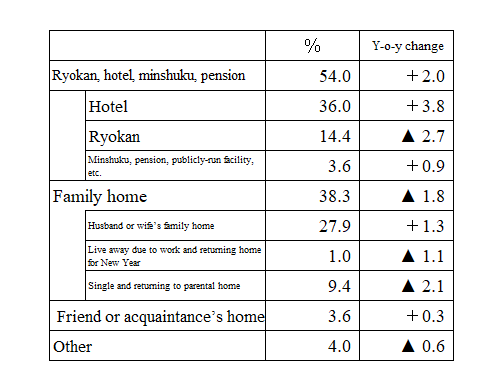
Table 11: Means of Transportation(multiple answers)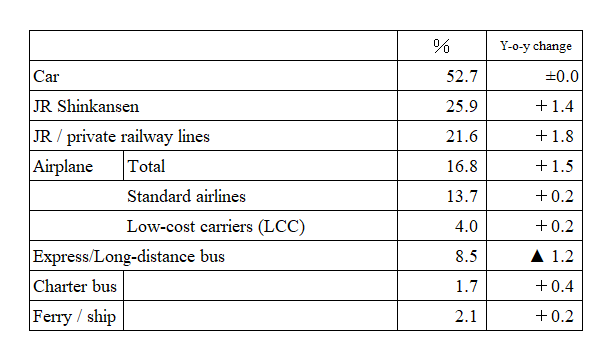 Table 12: Length of Trip(single answers)
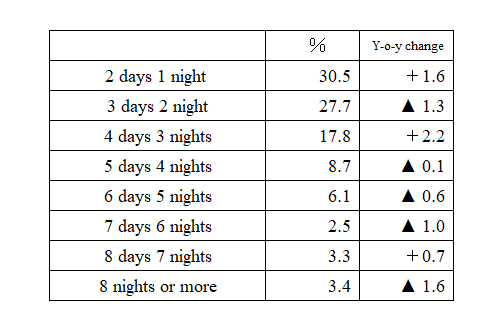
Table 13: Travel Destination(single answers)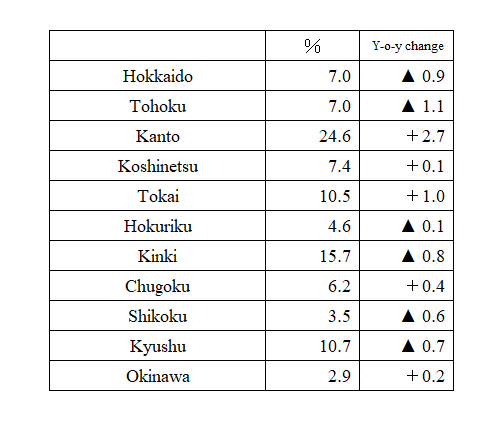
Table 14: Day of Departure (single answers)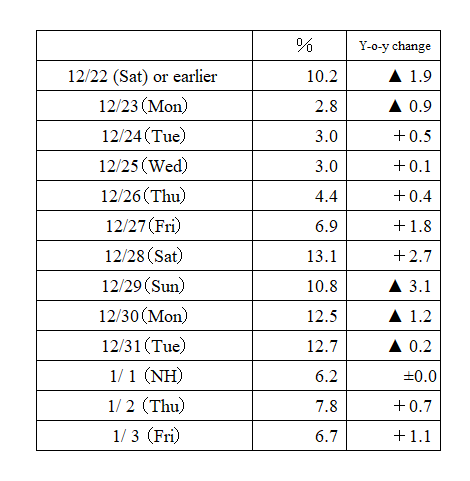
Table 15: Reasons for Not Traveling(multiple answers)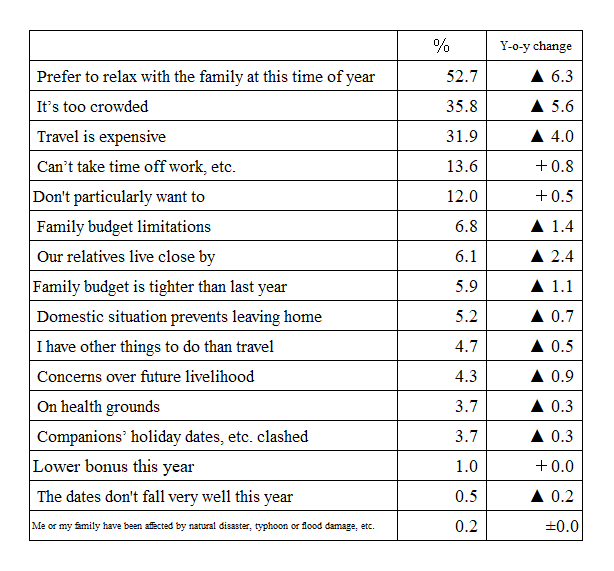 Note: In the above Tables 8 to 15, the lack of replies from some respondents or rounding down to the nearest decimal means that the total may not add up to 100%, even in the case of single response questions.
Table 16: Trends in Published Numbers for Year-End/New-Year Travel 2000-2019 (Dec. 23-Jan. 3 period) *First survey was conducted in 1969. 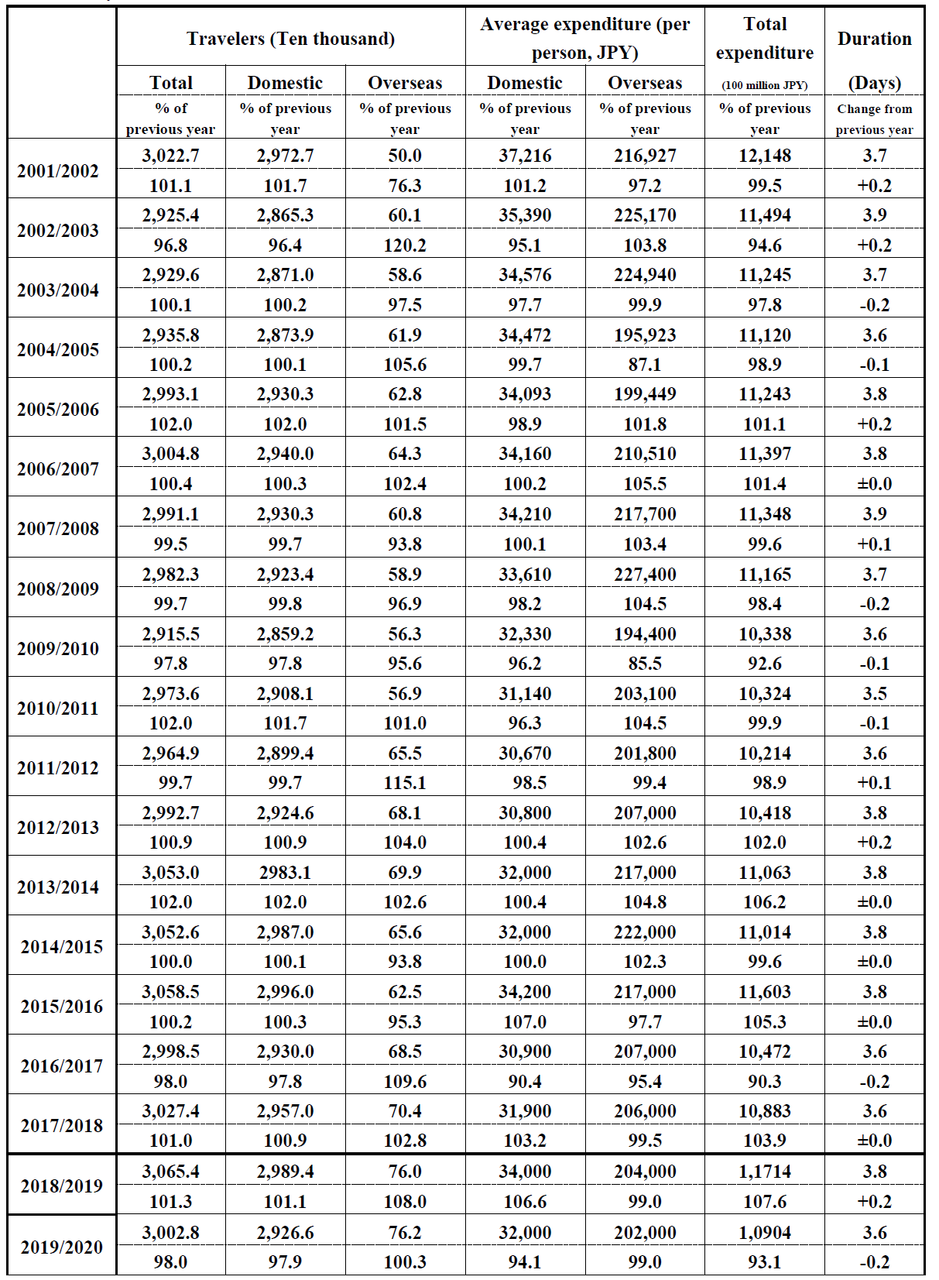
Tel: 03-5796-5833